Hear what our CIO of Global Assets, Pete Drewienkiewicz, has to say about markets this quarter.
CIO, Global Assets
Find me on LinkedIn
Drop me an email
This information has been provided solely for informational purposes and is not an offer, or solicitation of an offer, or a recommendation to buy or sell any security or instrument listed herein.
It was another bad quarter for markets as the MSCI World fell a further 5%, and bond yields continued to rise as Central Banks jawboned interest rates aggressively higher in the face of persistent inflation.
It’s been a brutal year for pretty much every asset class, which is shown here. Equities appear to be outperforming when you consider the extent of this year’s discount rate moves and flattening curves, which seem to be telling us we’re headed into a recession next year, but are we? In October, Jerome Powell looked a potential pivot in the face and shook his head, but then the latest US CPI number offered fresh hope to equity bulls. Where next for inflation? We take a deep dive. Meanwhile, fixed income looks interesting, tech, big and small, looks detonated and of course we can’t ignore the big story of the quarter – UK LDI. With markets in turmoil, IPOs are down … way down and credit issuance is also close to all-time lows.
The team have been working through a number of bespoke client projects in the last few months, ranging from helping to design a sustainable fund range for an insurance client, to assessing the in-house investment capabilities of a pension fund. We have also added a new Relative Value DGF to the roster and have been researching new UK equity managers.
In an attempt to clamp down on greenwashing, the FCA is proposing to introduce a package of measures. This includes sustainable investment, disclosure requirements and restrictions on the use of sustainability-related terms in product naming and marketing by asset managers. This could mean that funds that don’t meet the labelling requirements cannot be marketed as ‘ESG’ or ‘Sustainable’ funds to retail investors.
With COP27 underway in Egypt, we took a moment to assess the state of climate action in 2022. In short, progress has been limited and we’re currently still on track for a 2.4-2.8°C outlook. A big part of stepping up action is increased financing for climate mitigation and adaptation, especially in developing countries. We’re closely following the outcomes from COP27 and will produce a short summary with key takeaways for investors post-event.
Just in time for COP27, the IEA released their 2022 World Energy Outlook. The key takeaway is that Russia’s invasion of Ukraine is accelerating the energy transition. While there is a short-term boost in oil and coal demand, a peak in fossil fuels is expected within 15 years. With renewables being more price competitive than ever, it’s time to clean up the energy mix.
…funds that don’t meet the labelling requirements cannot be marketed as ‘ESG’ or ‘Sustainable’ funds to retail investors.
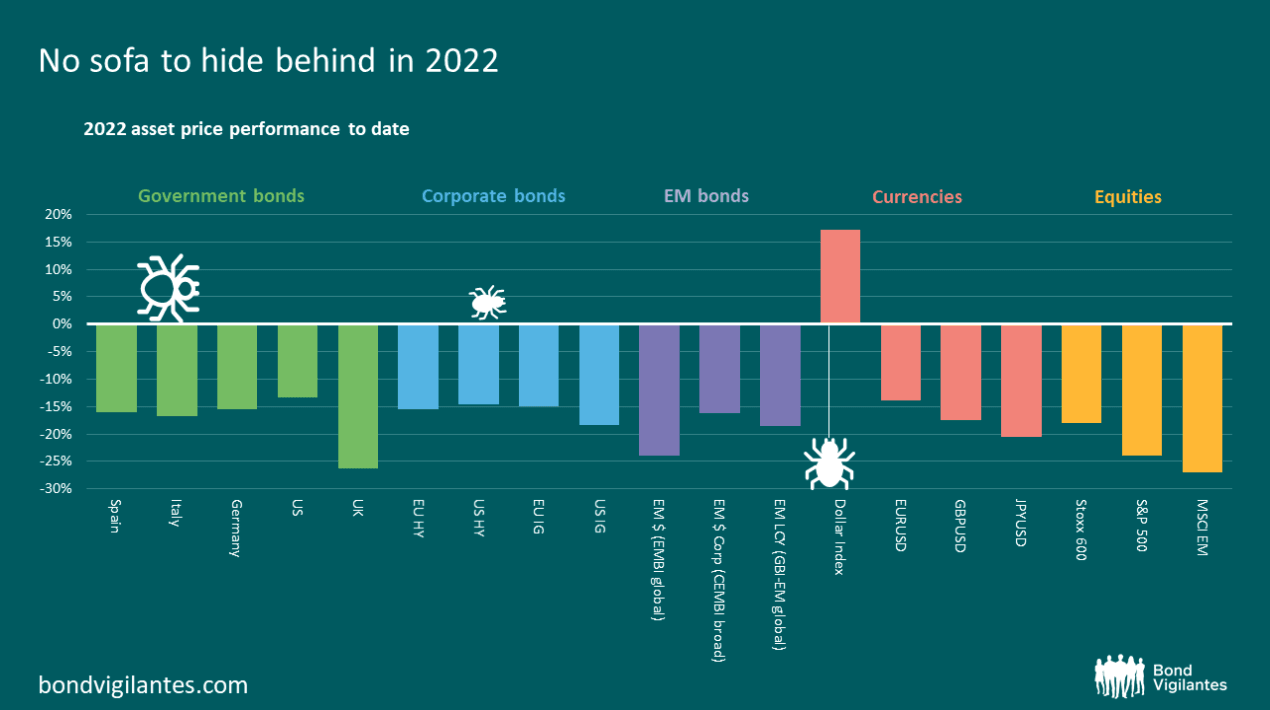
I was going to do another chart of 60/40 portfolio performance and then I found this (equally scary) one from the excellent Bond Vigilantes Blog. It highlights the complete dearth of bright spots in the investment universe. Outside of the dollar, which cracked a little recently, and commodities (not shown on this chart and notoriously underinvested by institutions), you can’t find a major asset that’s down less than c.15%. No wonder we’re seeing so much interest in alternatives all of a sudden!
TIP: Click the graph to zoom in
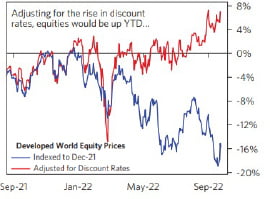
If you adjust for the rise in discount rates, says macro hedge fund Bridgewater Associates. Do discount rates feed 1:1 into equities? I don’t know. But I do know that when I can get 6% out of Investment Grade Corporate Bonds, the equity market surely needs to offer a healthy premium to that. Does it? Stocks are down 14.8% (MSCI World, GBP hedged) YTD, but Bridgewater’s chart suggests that they would need to fall another 4-5% just to keep pace with the rise in risk-free rates.
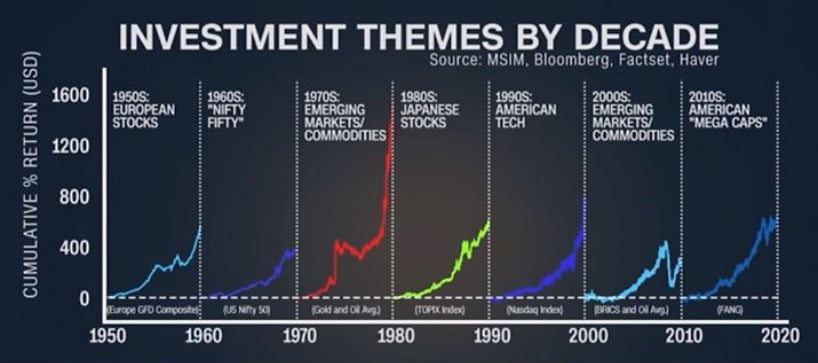
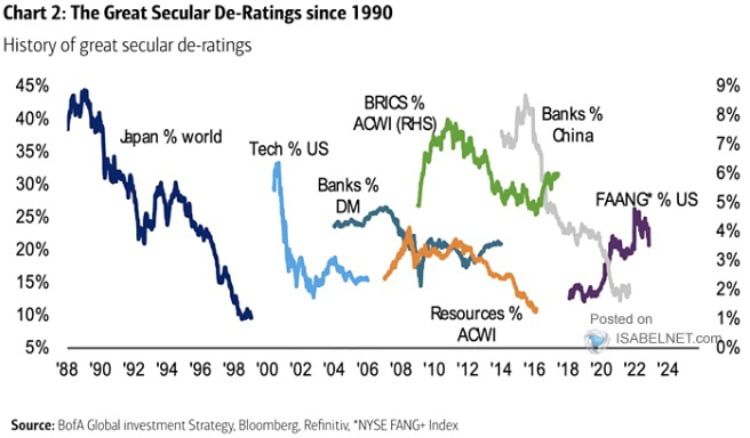
I love this graphic of all the big investment themes by decade. If you pasted a few years of crypto returns onto the back end of it, you’d have all the recent bubbles of our time. Suffice to say, none have ended that well, which probably doesn’t bode well for the 2020s in US tech mega-cap stocks. P.S. to find out how most of these worked out, skip to page 11!
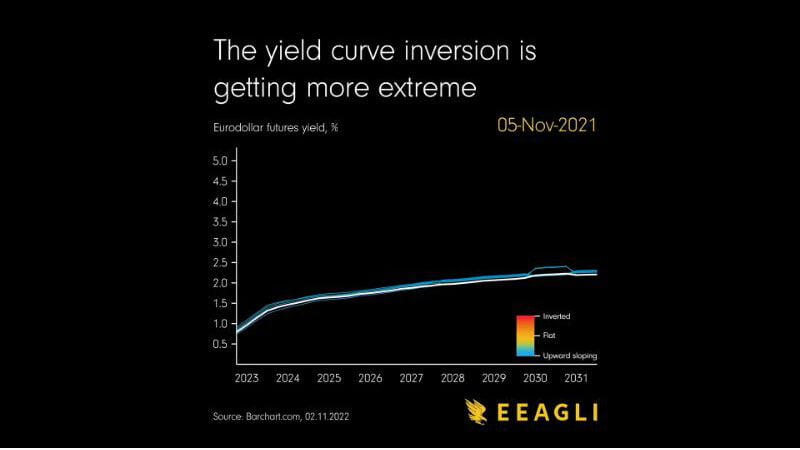
As Central Banks raise interest rates, two dynamics contend with one another – the front-end yield increases tend to push the curve flatter, while concerns about longer-run inflation tend to push the curve steeper beyond 10-years. This is, of course, a huge simplification, but one interesting feature of this year’s normalisation in interest rates has been some of the interesting yield curve shapes which have resulted. James Eagle’s great visualisation above (complete with euphoric soundtrack) shows the journey in the US yield curve over the past 12 months as the curve has moved higher and flatter, before taking on its now persistent ‘L-shape’, implying a rate hike pause, then reversal, as higher rates tip the economy into recession. The US economy remains extremely strong, with just 3.7% unemployment and most major indicators still accelerating. It may take longer for a recession to hit the US than many anticipate.
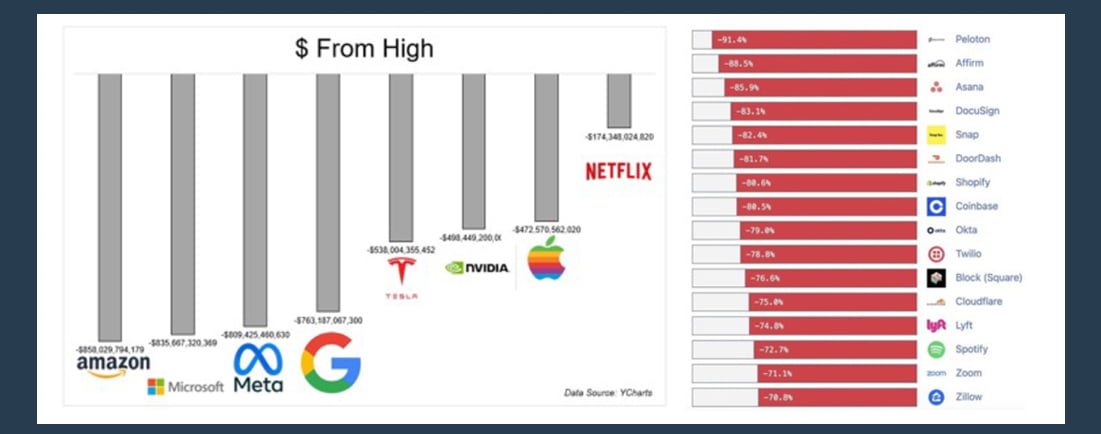
It’s a who’s who of market mayhem: Netflix has lost more in % terms, but the mega-cap tech stocks have ignited larger dollar values of investor capital since the start of 2022, with Amazon becoming the first public company to lose $1trn in market capitalisation. At the smaller end of the market, the absolute dollars look better, but the percentage drawdowns are savage – see Figure 5. This might be a good time to remind people that 90% of tech stocks went to zero in 2001/2, and even Amazon lost 95% of its market value. Is it the bottom? I don’t know, but I know the runway for a lot of the stocks on the bottom right has got a whole lot more limited.
Figure 5. Source: YCharts
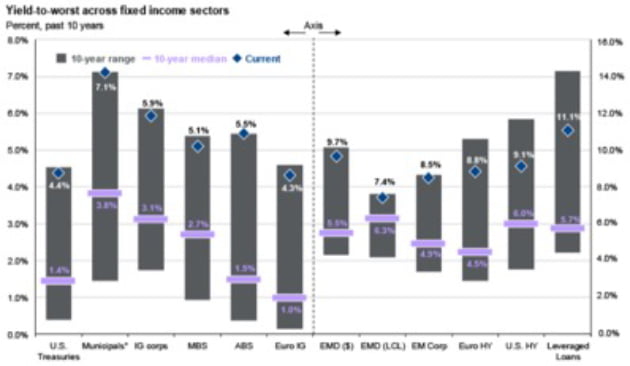
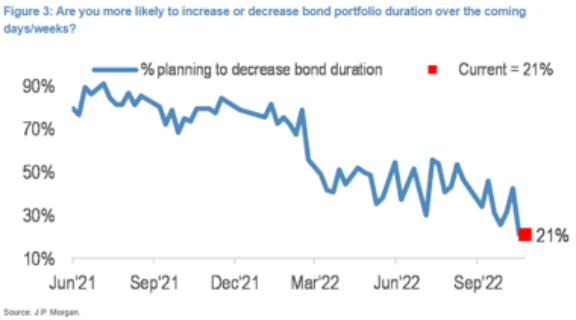
I thought fixed income markets already looked appealing in my last update, but JPM’s latest edition of their excellent Guide to the Markets shows an even higher proportion of the fixed income universe yielding close to its 10-year yield highs – particularly across higher quality and longer duration areas. The value in fixed income accelerated in October as a result of UK selling and has been picked up by investors in the last few weeks. I thought the chart opposite from JPM’s global research team was illustrative, with just 1 in 5 survey respondents thinking of cutting duration in the coming weeks. The market has quickly moved on from TINA: ‘there is no alternative’ (to equities) to ‘why would you buy stocks unless you need very high returns?’ in a staggeringly short period. What’s the acronym for that?
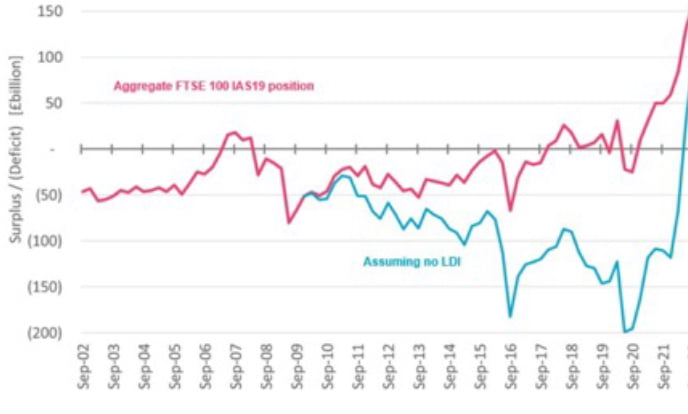
Earlier this year, following the ‘Kwartastrophic’ mini-budget announcement on 23rd September, the 30-year real gilt yield saw three successive days of 'largest ever daily move'. This set off a dash for collateral at UK pension funds, which led to a wide range of other assets being sold to shore up liability matching, or LDI, strategies.
The fall out from the episode has led to all sorts of hand-wringing by commentators on both sides of the aisles, but I found LCP’s chart (Figure 8), both brave and interesting. It shows that the aggregate IAS19 (accounting) deficit of the FTSE100 has vanished over the previous 12 months as yields have risen, but also that without the smoothing effect of LDI, it might have been as much as £200bn worse off in the depths of the Covid-19 crisis. Clearly the devil is in the detail, but it looks unlikely that anyone who adopted LDI before early 2016 would still be better off today, partly as a result of reinvesting LDI gains into growth assets, while experiencing an overall smoother ride.
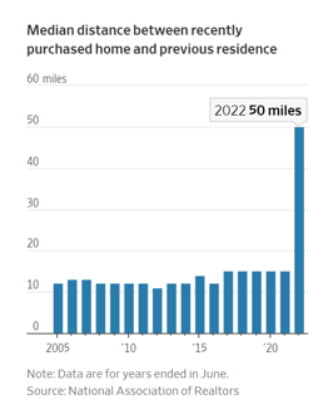
Figure 9 from the US National Association of Realtors is an astonishing visualisation of the acceptance of remote work – the median distance between a newly purchased home and the prior residence more than tripled between 2021 and 2022 in what can only be described a residential regime shift. Will it persist? In recent days, Elon Musk ended remote work at Twitter, while Jamie Dimon told employees “you can’t stay in your pyjamas all day” in February. I think 2022’s data point is likely to be an outlier for all time.
Figure 9. Source: US National Association of Realtors
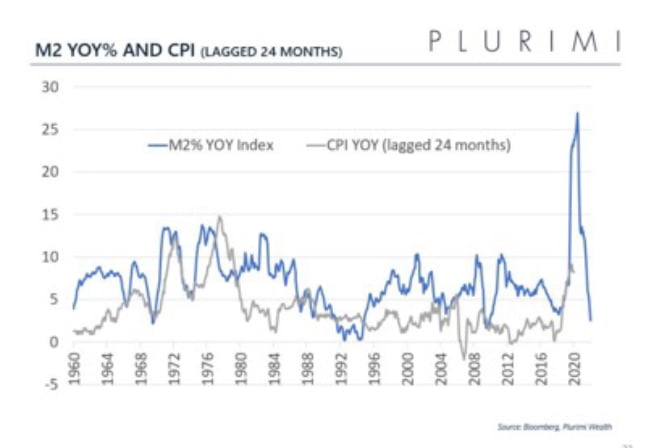
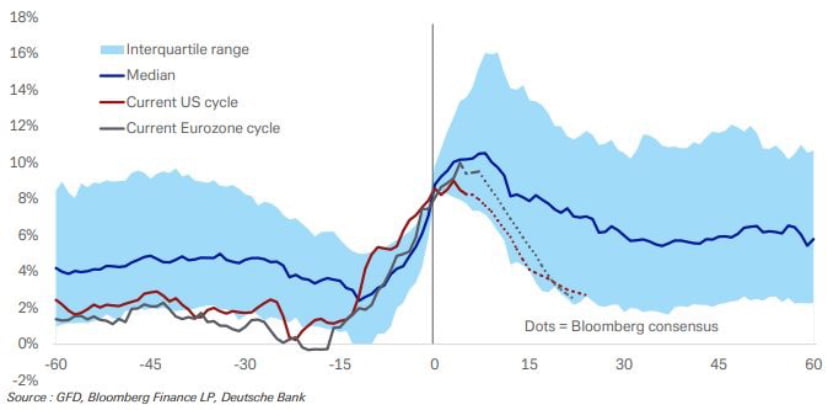
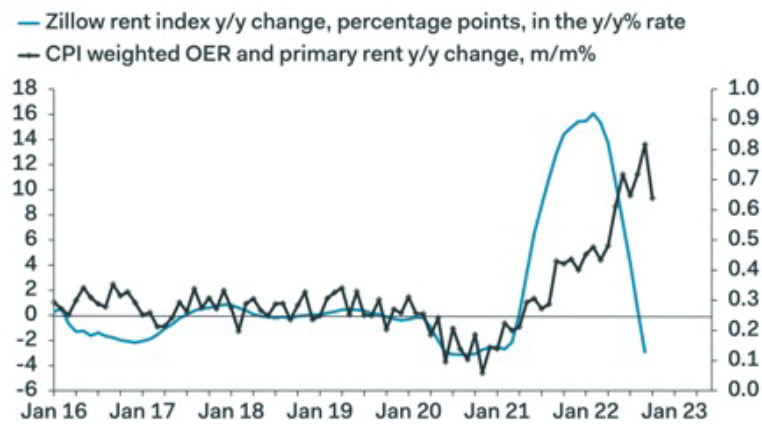
Where now for inflation? It’s an absolutely crucial question for markets, as the S&P 500’s strong reaction to the weaker-than-expected October US CPI print demonstrates. The problem is, nobody really knows. In the blue corner, we have the ‘roll-overs’, who are looking at the collapse in the rate of expansion of the monetary base (Figure 10) and anticipating that CPI will follow suit. They are also enthused by the weakness in the US Zillow rent index, which suggests that shelter-driven inflation might also roll over quickly in 2023. Meanwhile, in the red corner we have the ‘sticky-ites’, who cite history and the piece of Deutsche Bank research (Figure 11), which seems to tell us that inflation takes longer to flush out after it rises above 8%, certainly longer than the dotted forward consensus projections seem to suggest. What do you think? Answers on a postcard.
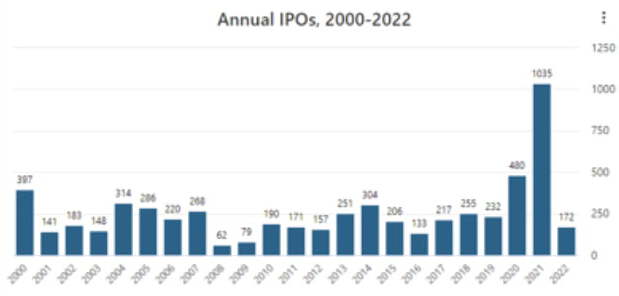
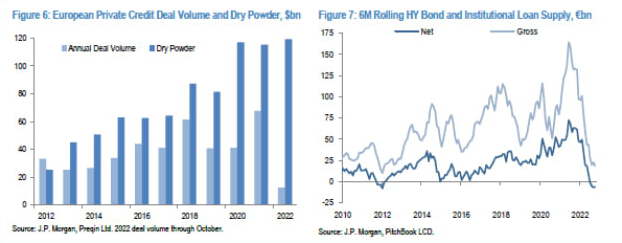
In challenging markets, new issuance is always one of the first things to go, but you might be surprised quite how far. Figure 12 shows IPOs down sixfold from 2021 – although 80 of this year’s 172 were completed in Q1, flattering activity levels since then. It’s a similar story in credit, JPM analysis below shows it’s a record low year for European private credit deal flow and the rolling supply of sub-investment grade debt is close to a 12-year low. This makes the credit markets in particular very vulnerable to a rapid snapback on any sustained inflows – there just isn’t enough product about to buy.
Disclaimer
For professional investors only. Not suitable for private customers. The information herein was obtained from various sources. We do not guarantee every aspect of its accuracy. The information is for your private information and is for discussion purposes only.
Redington Ltd is regulated by the Financial Conduct Authority. Redington Ltd do not advise on all implications of the transactions described herein. This information is for discussion purposes and prior to undertaking any trade, you should also discuss with your professional tax, accounting and / or other relevant advisers how such particular trade(s) affect you. All analysis (whether in respect of tax, accounting, law or of any other nature), should be treated as illustrative only and not relied upon as accurate.
©Redington Limited 2022. All rights reserved. No reproduction, copy, transmission or translation in whole or in part of this presentation may be made without permission. Application for permission should be made to Redington Limited at the following address – Floor 6, One Angel Court, London, EC2R 7HJ.
Redington Limited (06660006) is registered in England and Wales. Registered office: One Angel Court, London, EC2R 7HJ
Redington Ltd.
Floor 6 One Angel CourtLondon EC2R 7HJ+44 (0)20 7250 3331
redington.co.uk