Hear what our CIO of Global Assets, Pete Drewienkiewicz, has to say about markets this month.
Pete DrewienkiewiczCIO, Global Assets
Find me on Linkedin
Drop me an email
June was another rough month for risk assets in what is turning out to be quite a rollercoaster of a year. It was the worst first half for the S&P 500 in some 52 years as well as for the US bond market (and likely many more bond markets), meaning that traditional assets had their weakest joint performances on record. Although a dramatic strengthening of the dollar cushioned foreign holders of equities from some of this volatility.
Against this backdrop, liquid alternatives, including trend-following, have performed relatively well, spurring more interest and substantial inflows – will it be the usual story of flows following performance in both directions? Interestingly, commodity prices are now starting to roll over and even those trend-followers are not running large long positions. We’re starting to see some value in areas of the credit market and take a deeper dive into the outlook for earnings – one of the focus areas for the second half of the year. We also look at the BoA's analysis of the biggest bubbles on record.
Moving forwards, Thoughts from the Loft will shift to a, hopefully slightly more leisurely, quarterly routine, so look out for your next scheduled dose of charts, graphs and bad takes at the end of Q3.
Our Active Global Government Bond research has been approved for client use by Redington’s Investment Strategy Committee. We believe this is a good option for certain wealth and other non-pension funds. Our Long Income Preferred List – a property asset class that a number of our clients have exposure to – was also signed off during the month.
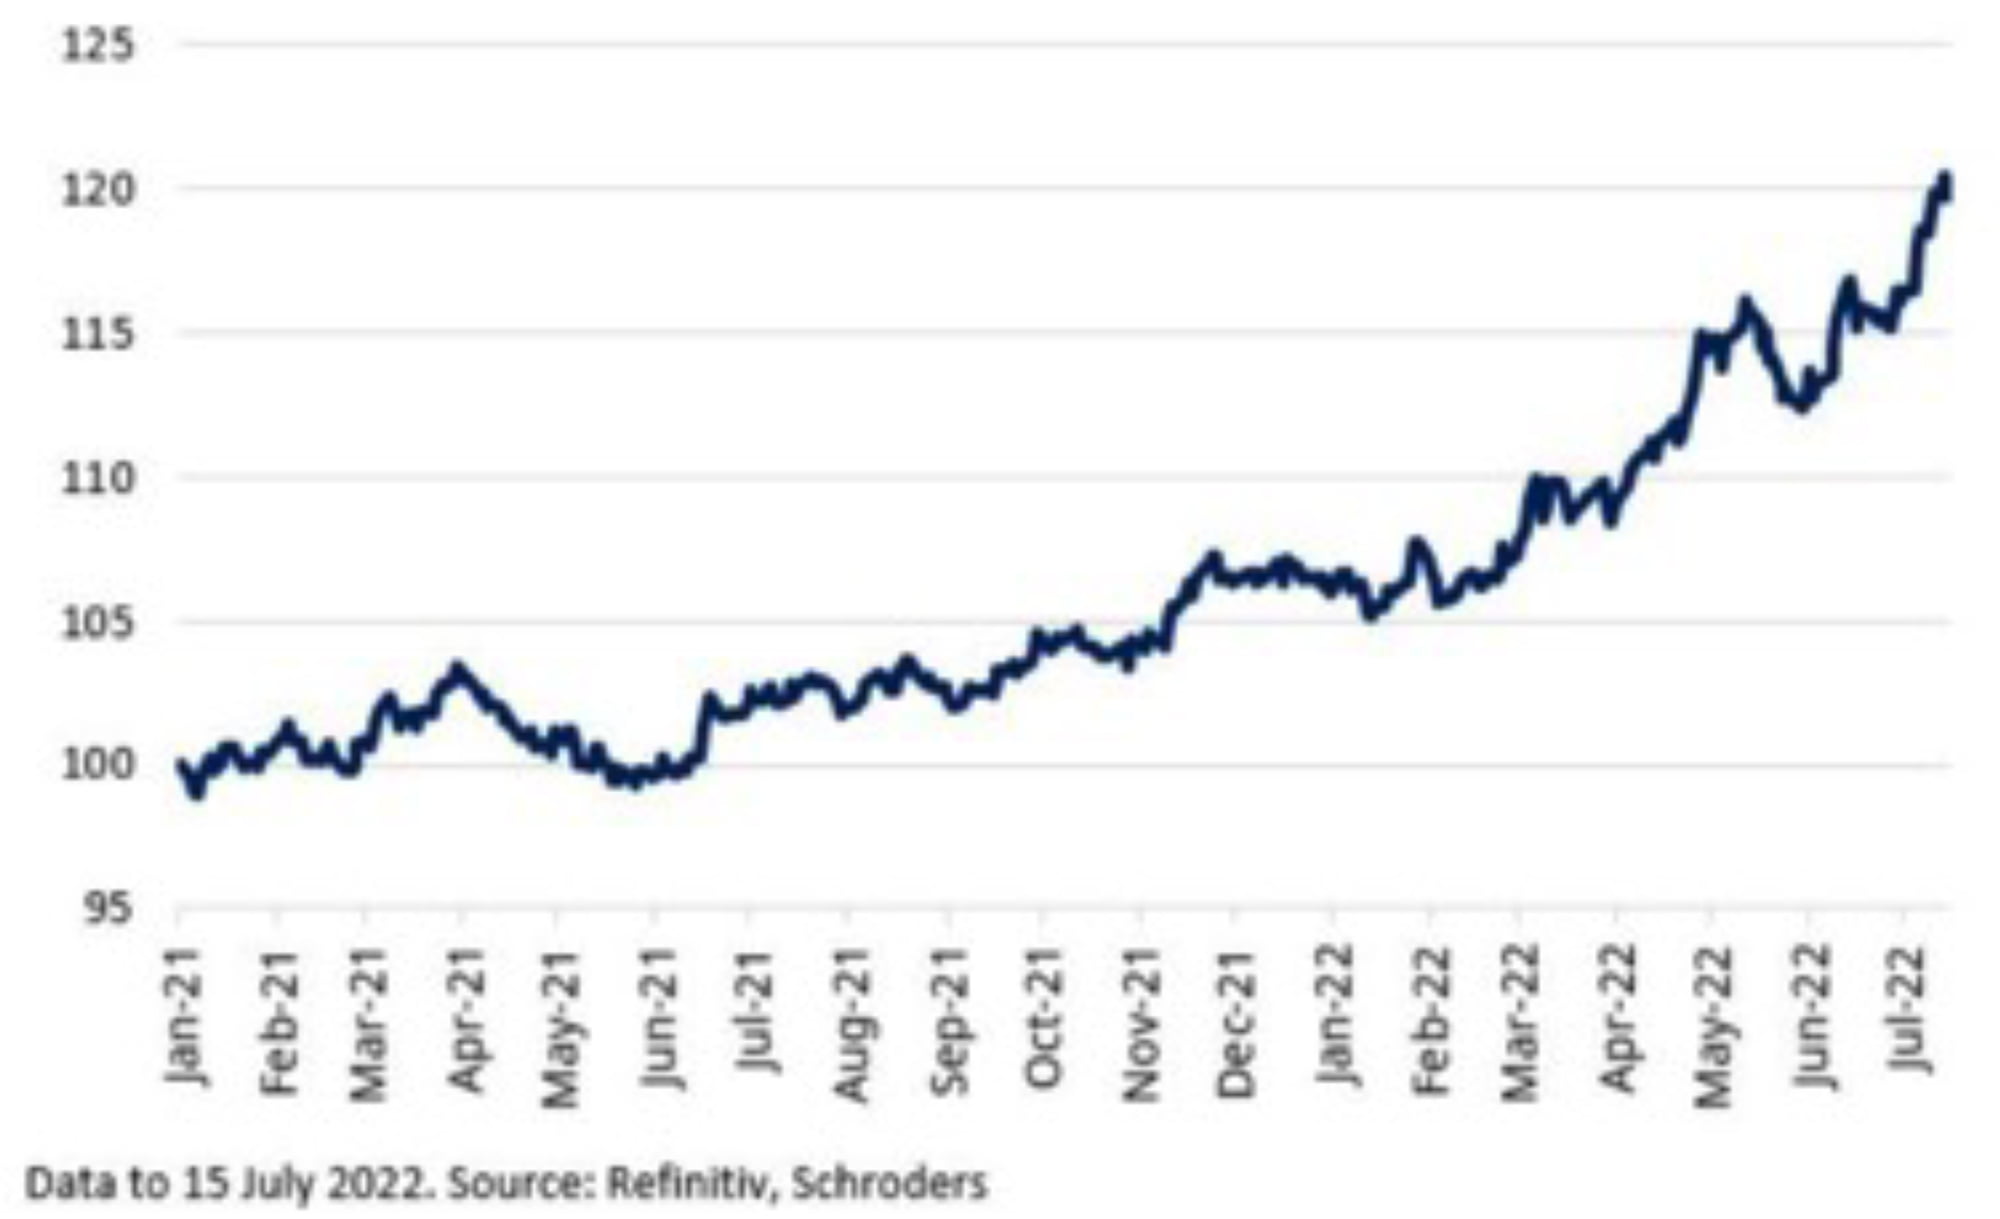
One of the prevailing themes for the first half of 2022 was a dramatically stronger US dollar. Against a backdrop of a strong US economy, the Fed moved most aggressively to ‘catch up’ to the curve and is poised to continue this policy with a 75 or 100bps rate hike at its upcoming meeting in late July. The move has pushed EURUSD close to parity but also sheltered pan-European investors from much of the volatility in global equities (since 69% of the MSCI World constitutes US companies) and created a significant disparity in portfolio performance around the world. Looking forward, if Central Banks are committed to ‘hiking till something breaks’, I don’t see how any of them will manage to push rates higher or faster than the Fed, and hence I suspect this trend against non-US currencies may persist.
The FCA has expressed its support for the regulation of ESG data and ratings agencies after consulting the industry. The FCA said it supports the government’s consideration of bringing the oversight of these products and services under the regulatory umbrella. The move is said to contribute to the FCA’s overarching aims, which are to protect consumers and the integrity of the UK financial system, as well as to promote competition in the interests of consumers.
Following a recent European Commission vote, nuclear and natural gas-fired power plants will be recognised as a transitional energy source in the EU’s Green Taxonomy. This is provided they replace a coal- or fuel oil-fired plant, switch to low-carbon gas by 2035 and stay under a maximum emissions cap. The decision was met by many opposing it as “a failure for Europe and the climate”.
According to a recent report, half of the world’s largest asset managers are considering implementing client-led voting in pooled funds, with a quarter actively investigating the possibility. The survey was conducted by the Occupational Pensions Stewardship Council (OPSC) and was based on 44 managers globally.
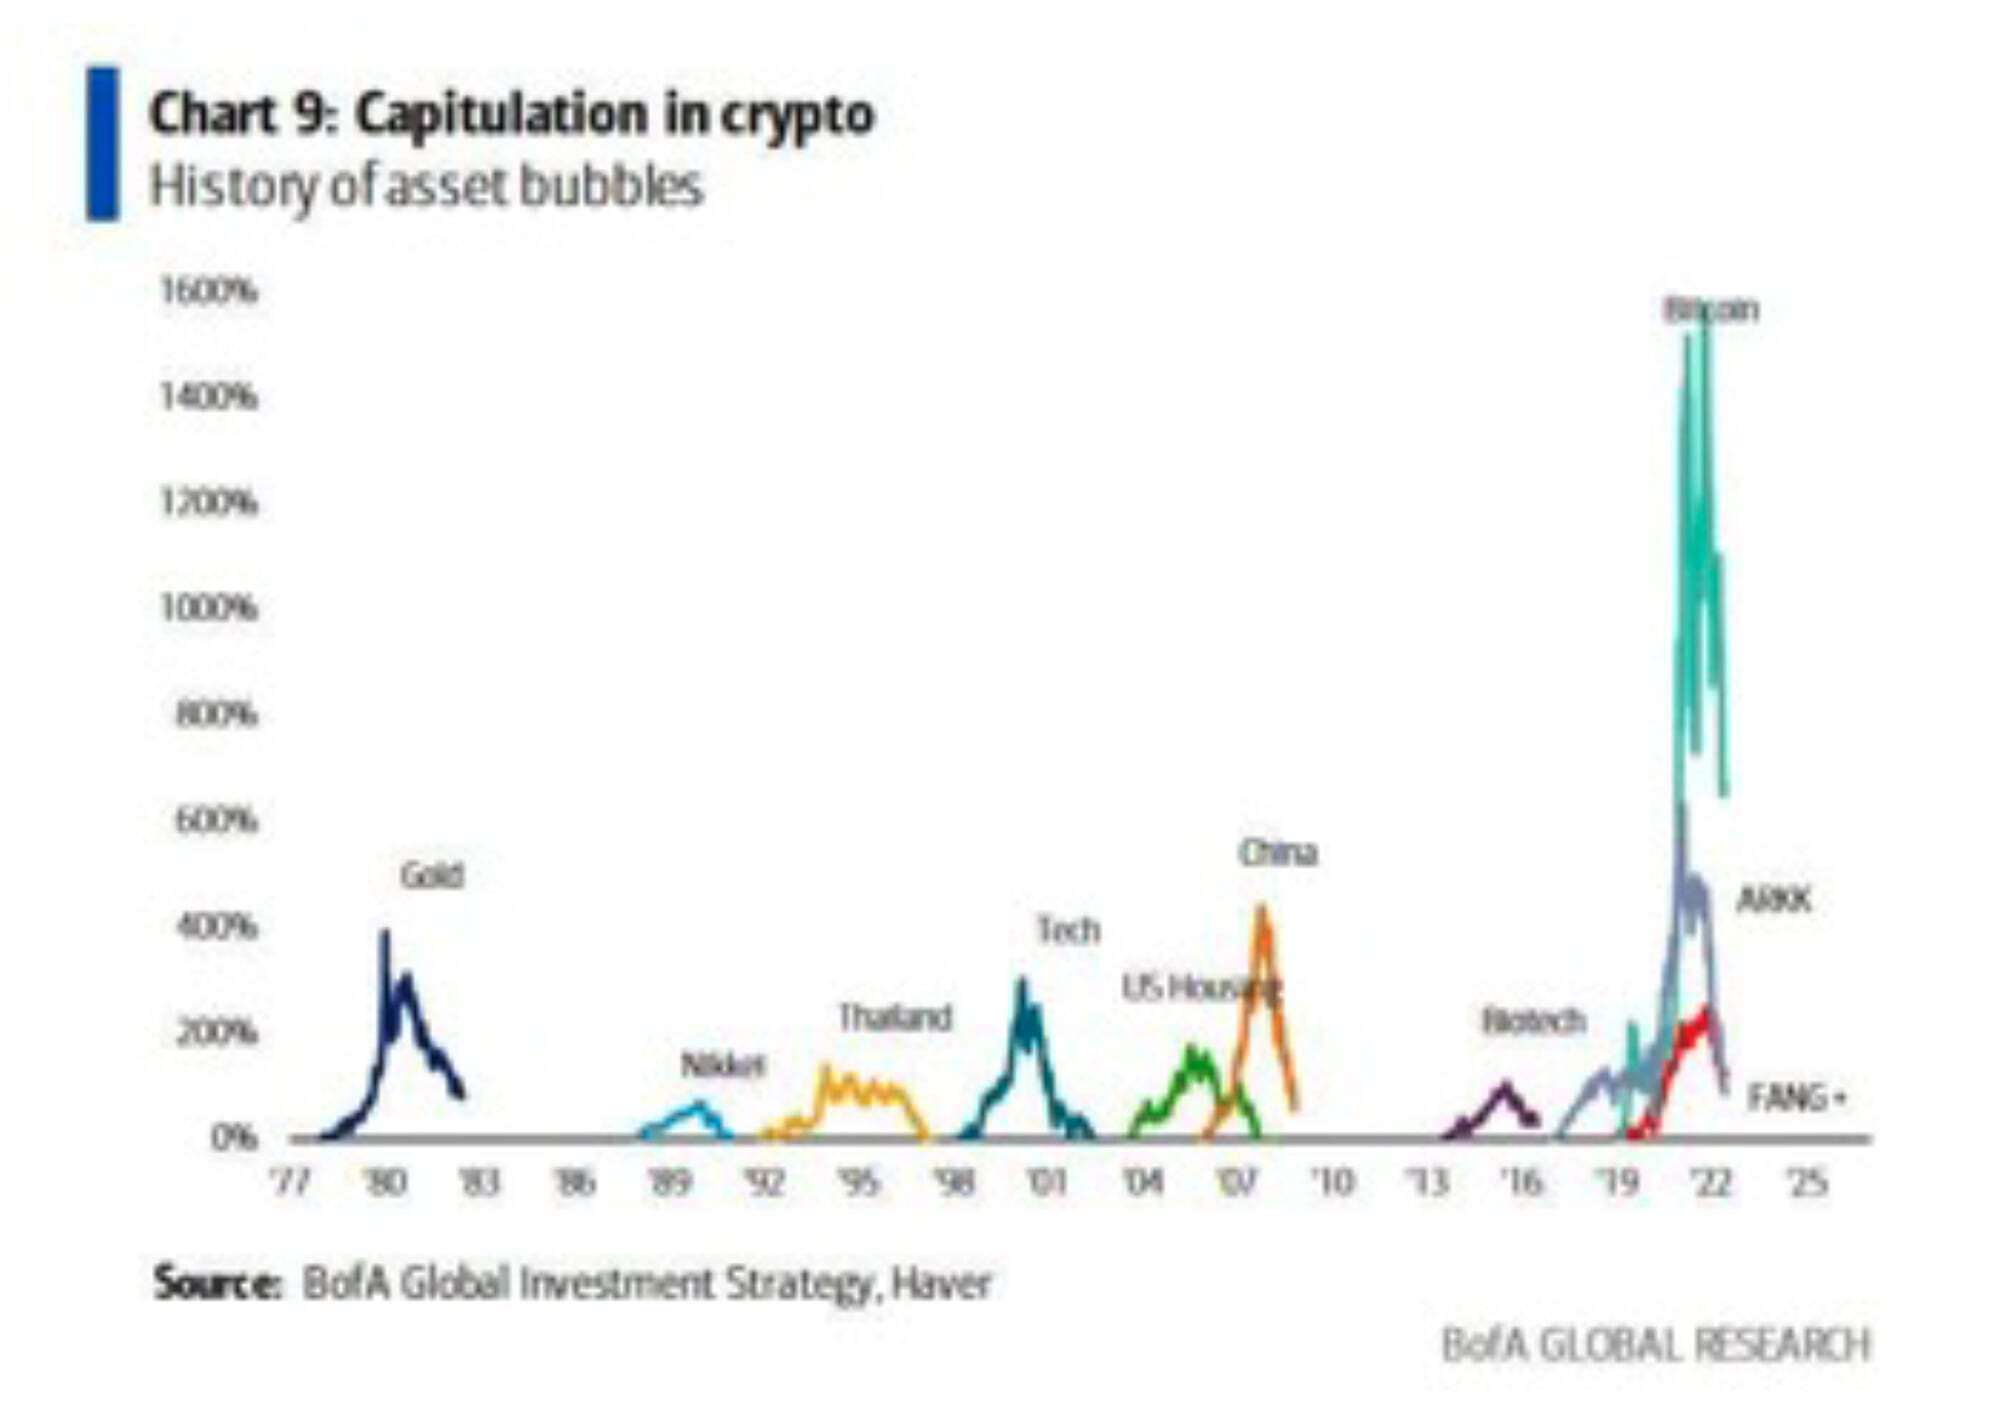
Maybe it’s a little early for BoA’s global research team to append Bitcoin (turquoise) to a chart of the greatest asset bubbles in history, but the chart above certainly gives you some insight into how staggering the cryptocurrency’s rise has been over the past few years – and how volatile it has been ever since. I don’t know about you, but I want to see tulips and the South Sea Company on this chart, BoA. Certainly, Bitcoin looks increasingly like an undertaking of great advantage, but nobody to know what it is [for].
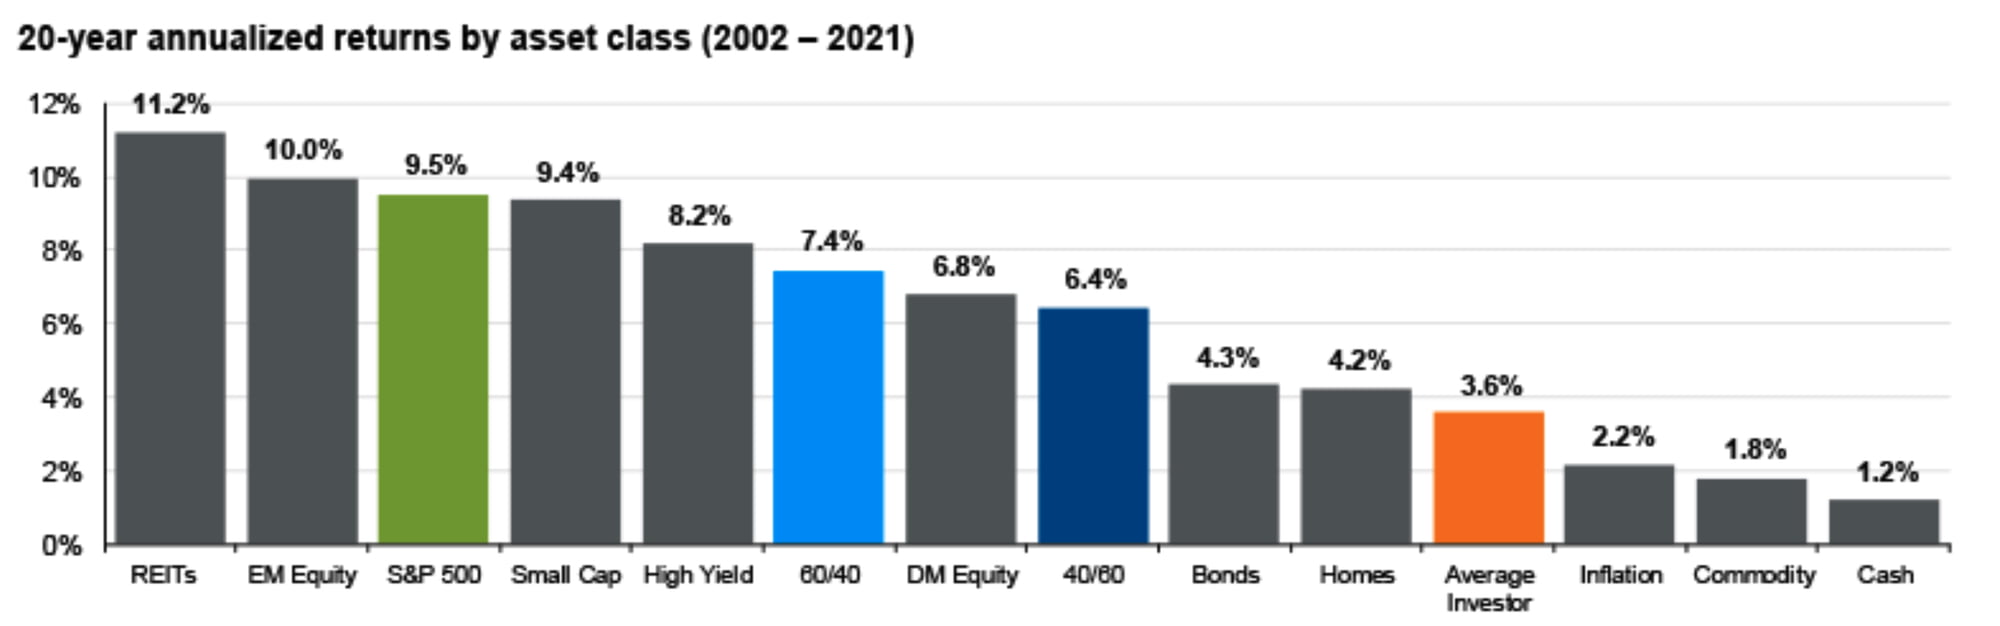
The most depressing chart in investing – this shows the gap between the return of a 60/40 (light blue) or 40/60 (dark blue) portfolio and what the average investor actually earns, in orange. Return chasing, buying and selling at bad times and paying fees that are too high all contribute to a gap that could be as high as 50% of gross returns. Sigh.
Source text. This information has been provided solely for informational purposes and is not an offer, or solicitation of an offer, or a recommendation to buy or sell any security or instrument listed herein.
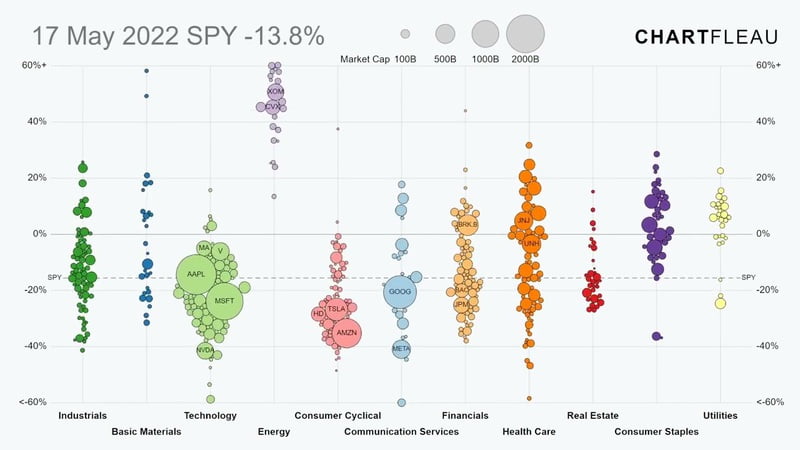
As part of the move to a quarterly cadence, I get a bit more time to think about what we want to put in, and the Marketing team found a way to include interactive content. So here it is – 2022 marked the worst first-half performance for the S&P 500 in 52 years. The dynamic chart above shows you the higher level of dispersion which has also been experienced – the best performing sector is of course the very much under-owned energy sector (in mauve) while you can also see the poor performance of technology and consumer cyclicals, which owes much to the high levels of inflation.
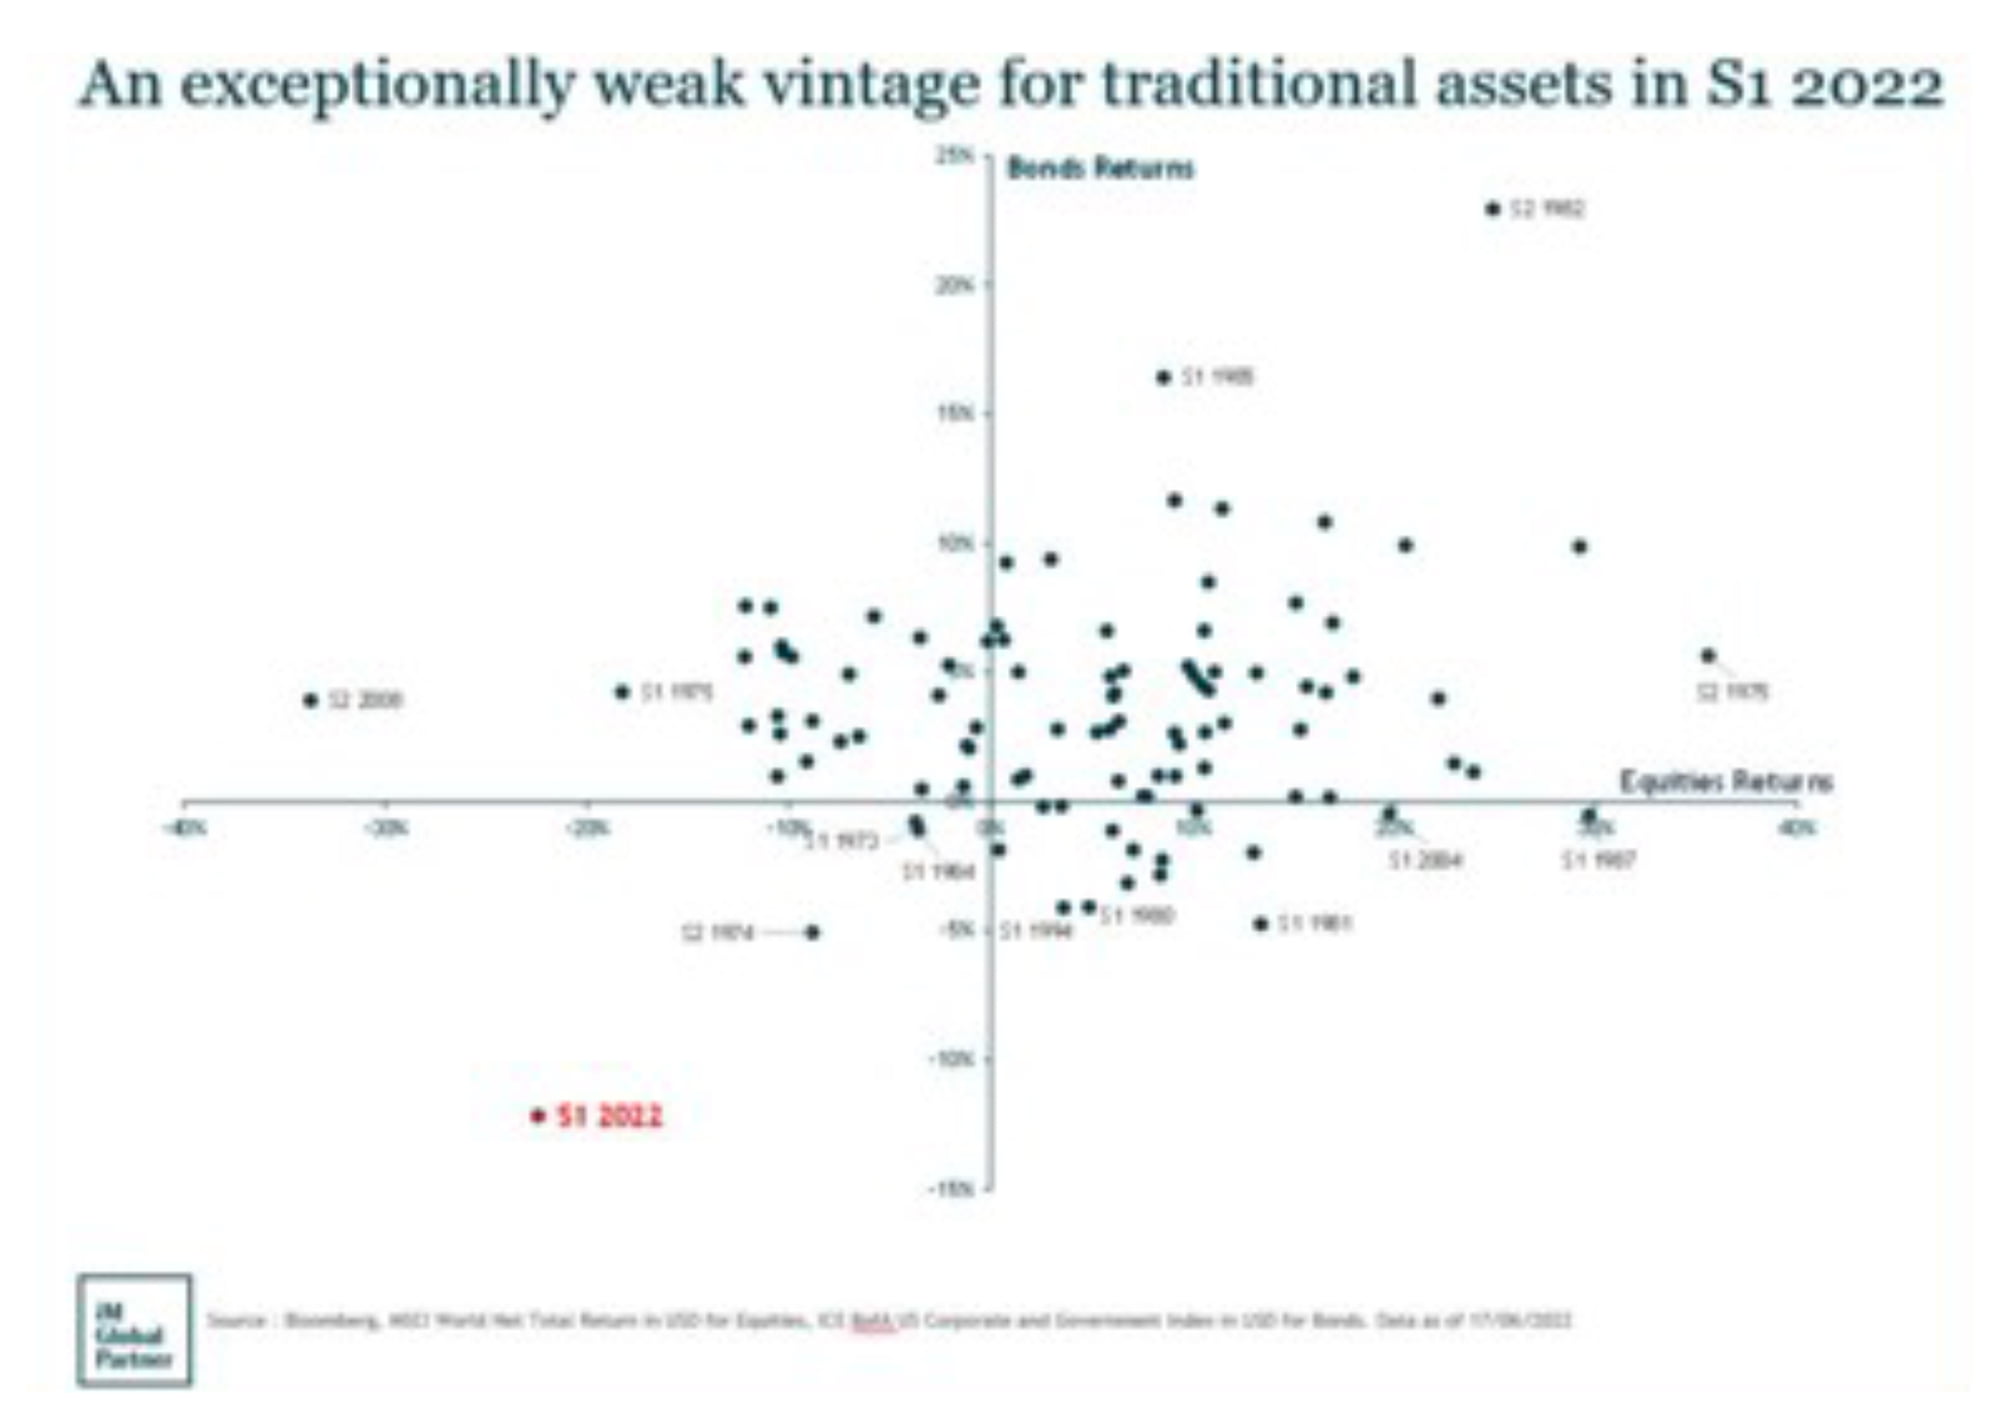
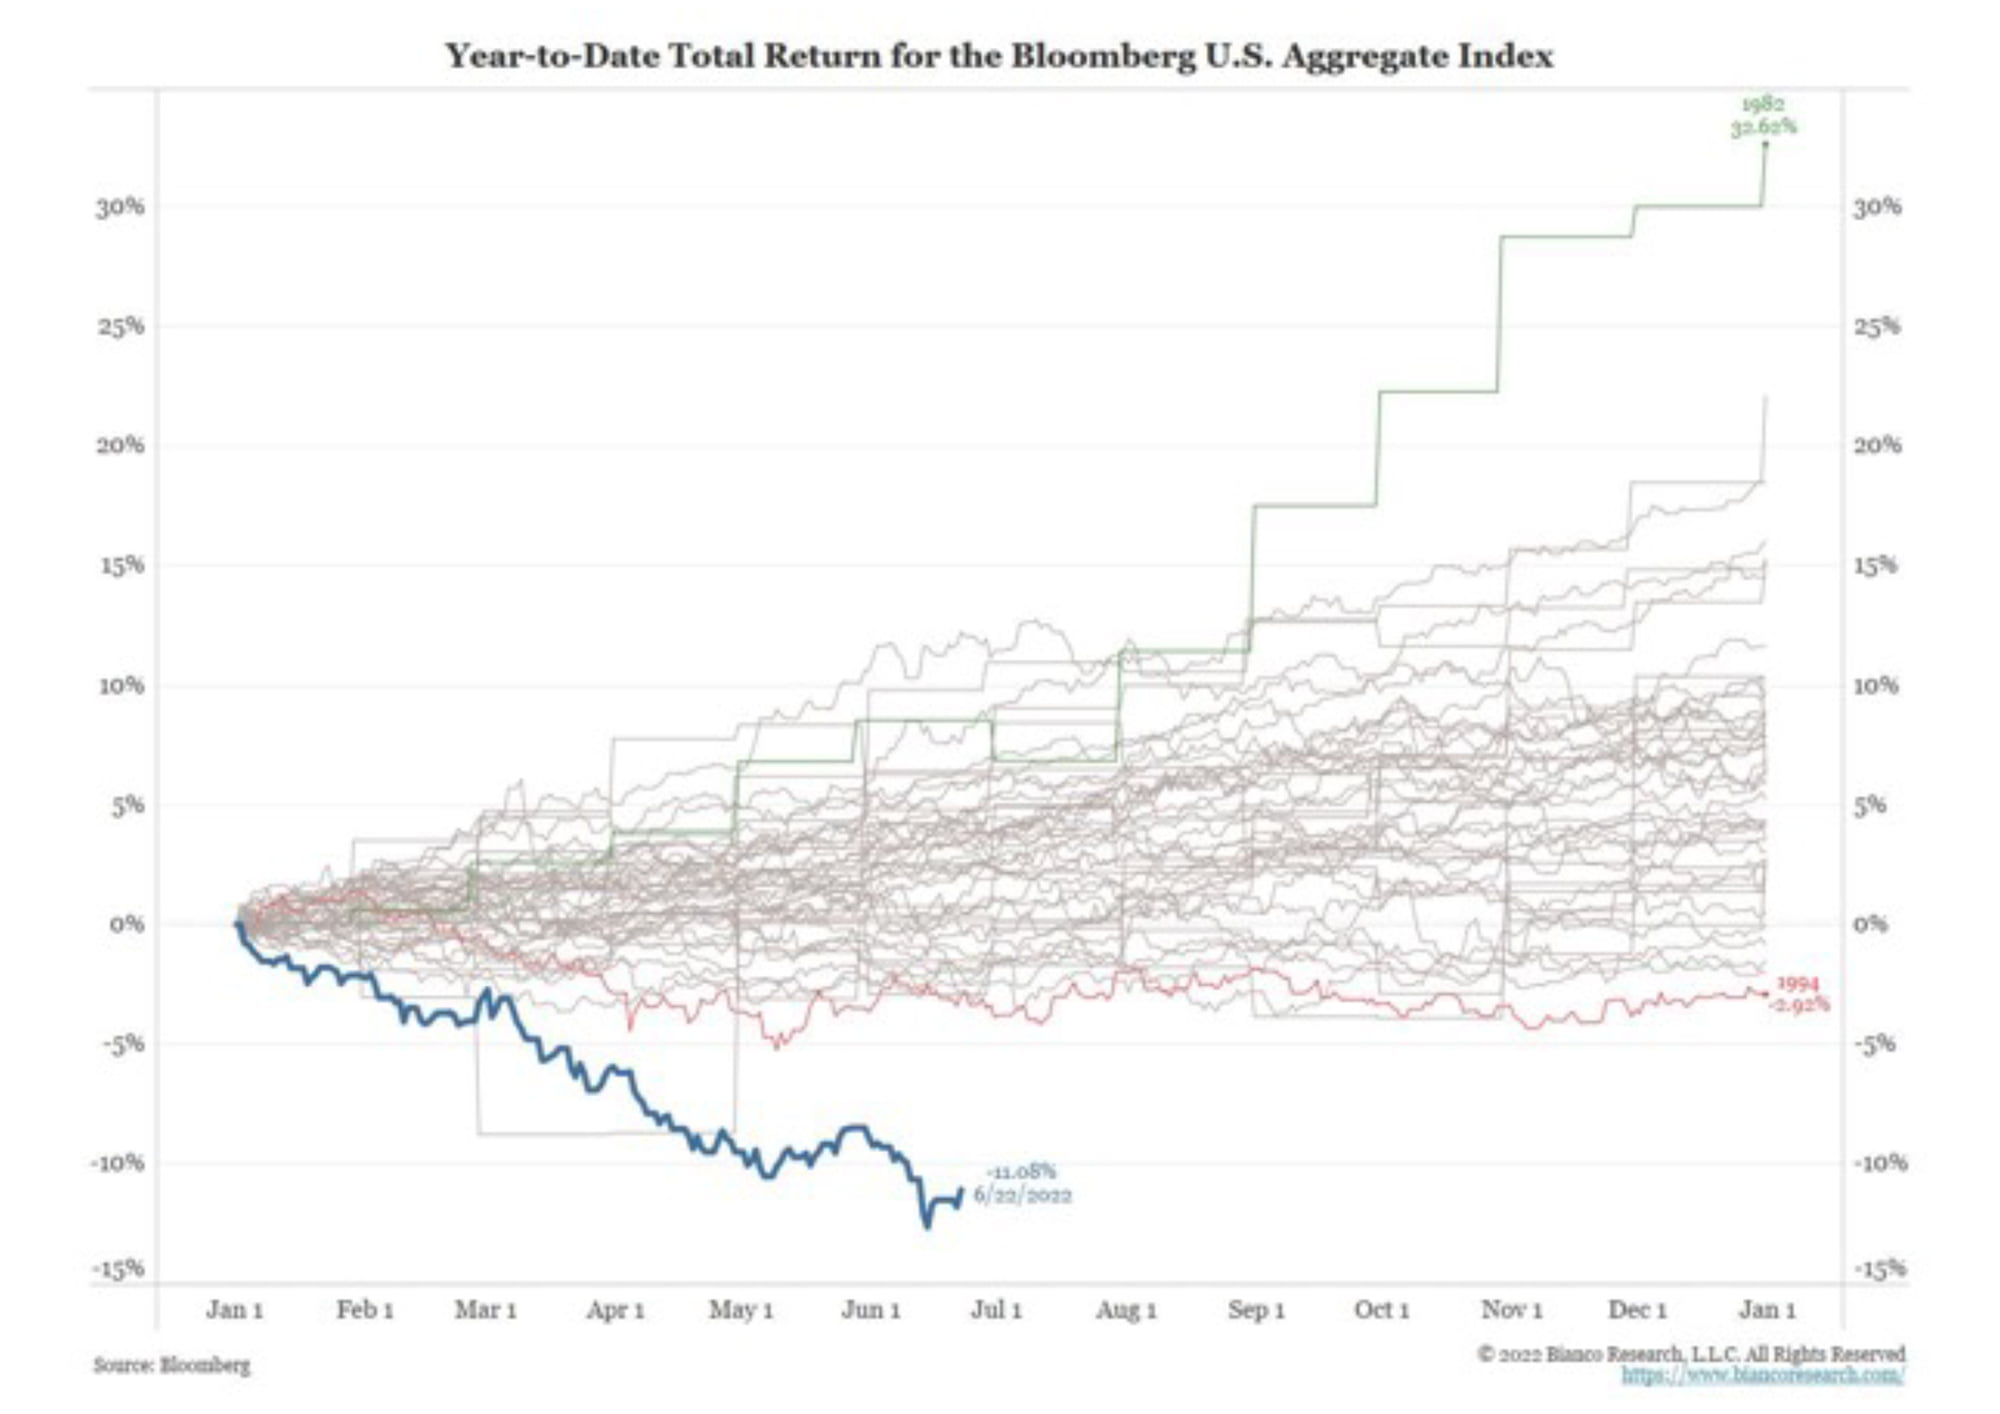
I feel a bit like one of my client’s favourite sayings here, “teaching granny to suck eggs”*, but let’s face it, the breakdown in what is accepted to be the usual asset relationship has been the biggest story of the first half of 2022. The two charts on the right show you quite how exceptional the market movements have been. On top, the worst half for at least 50 years – a complete failure of diversification which will have a fair few individuals gazing at their investment reports and saying, “what the heck?”, driven particularly by the bottom chart – the worst performance by bonds also going back 50 years. No, 1994 (the red line at the bottom of the cluster) wasn’t even close, before you ask.
*If you know what on earth this saying is about, please email me ASAP!
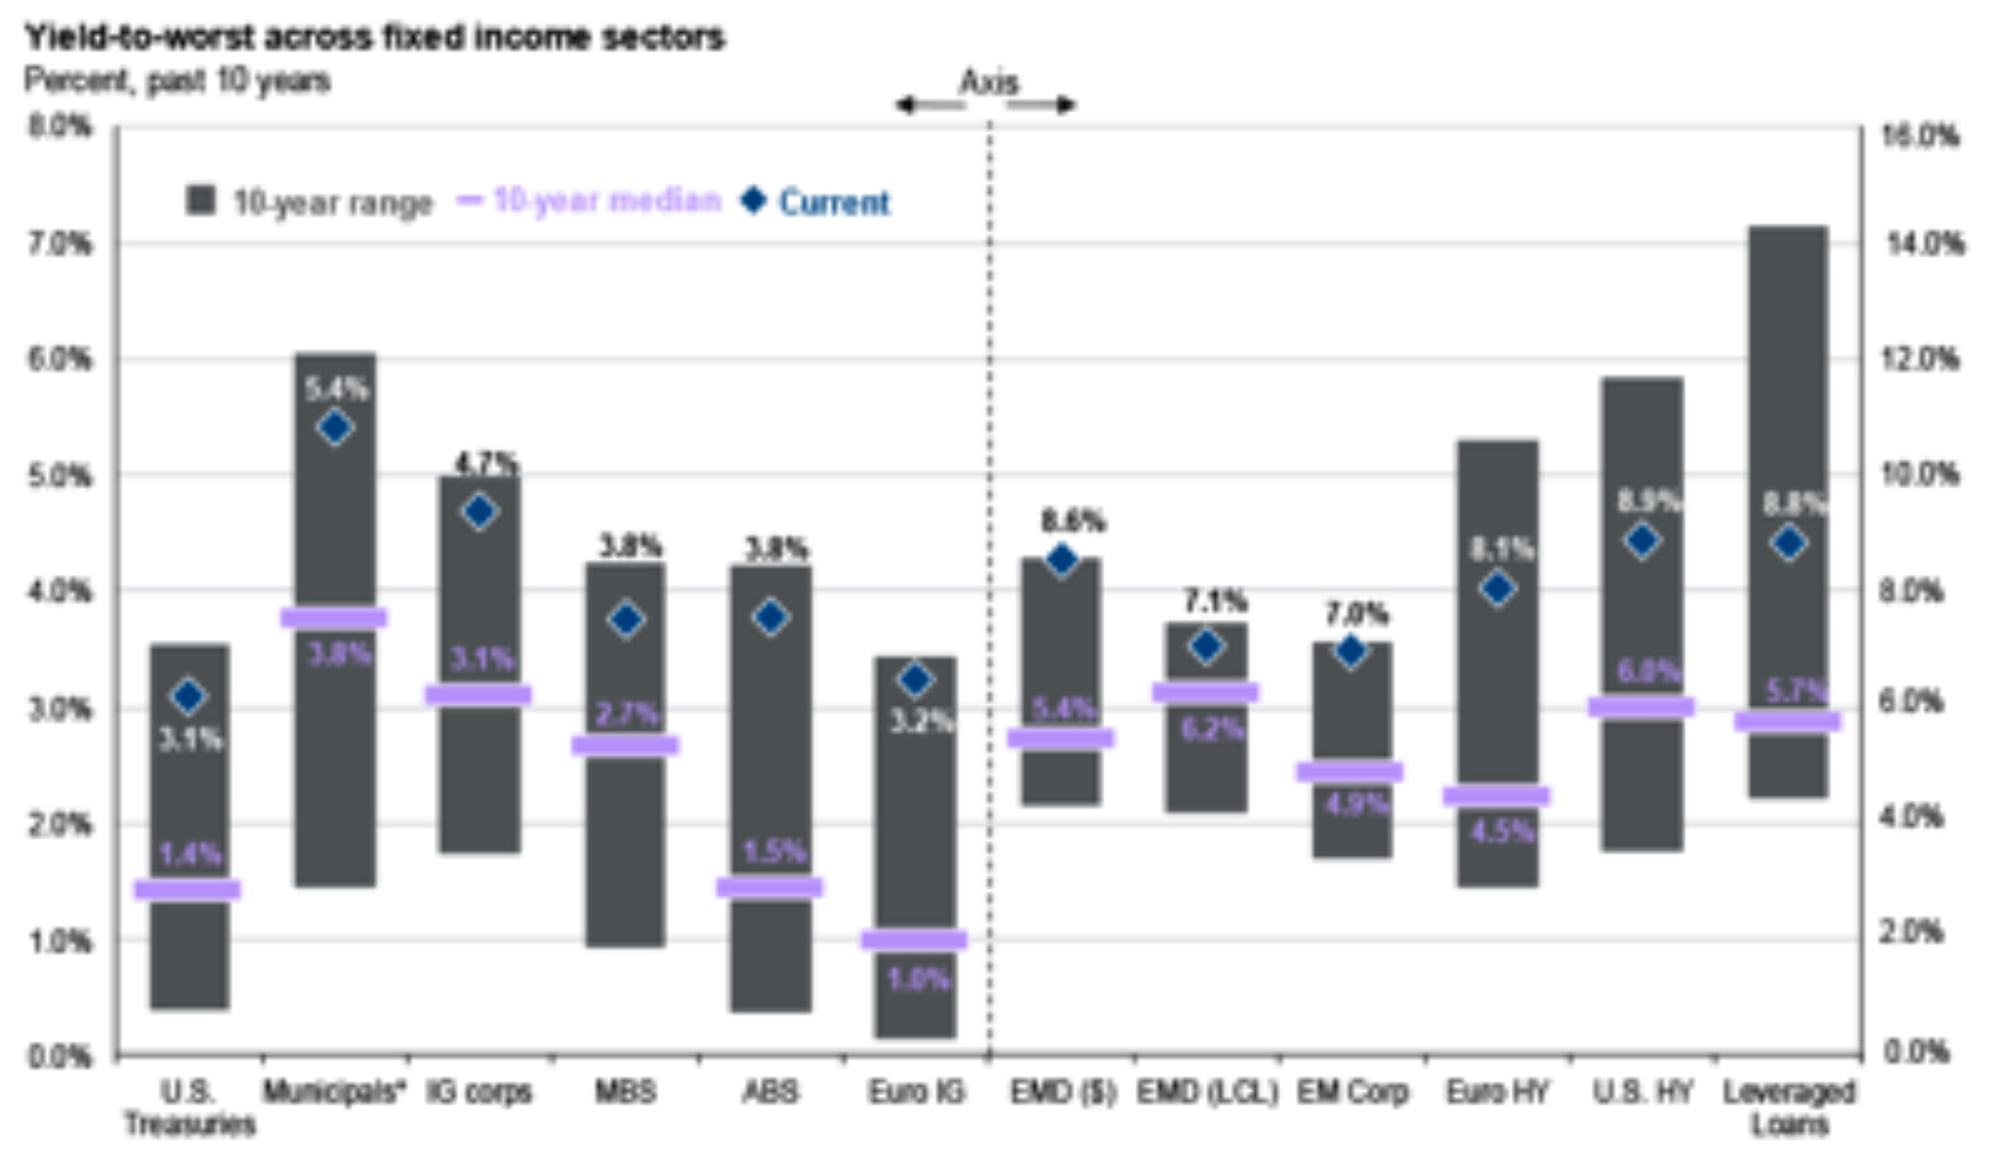
As rates have risen and credit spreads have widened, the environment has rapidly changed in 2022 – while likely earnings erosion through the second half of 2022 could pressure equities further. There are now plenty of good alternatives, as this great chart from JPMAM’s Guide to the Markets illustrates. Grey bars show the 10-year range of yields, purple lines the 10-year medians and blue diamonds are yields available at the end of Q2. My key takeaways:
Hard-currency sovereigns normally trade close to US HY levels, as they do today with an approx. 9% yield, despite a much lower default track record, suggesting an opportunity. It’ll be interesting to see if some of that equity overweight cash gets recycled into fixed income at these attractive yields given the better outlook for the asset class.
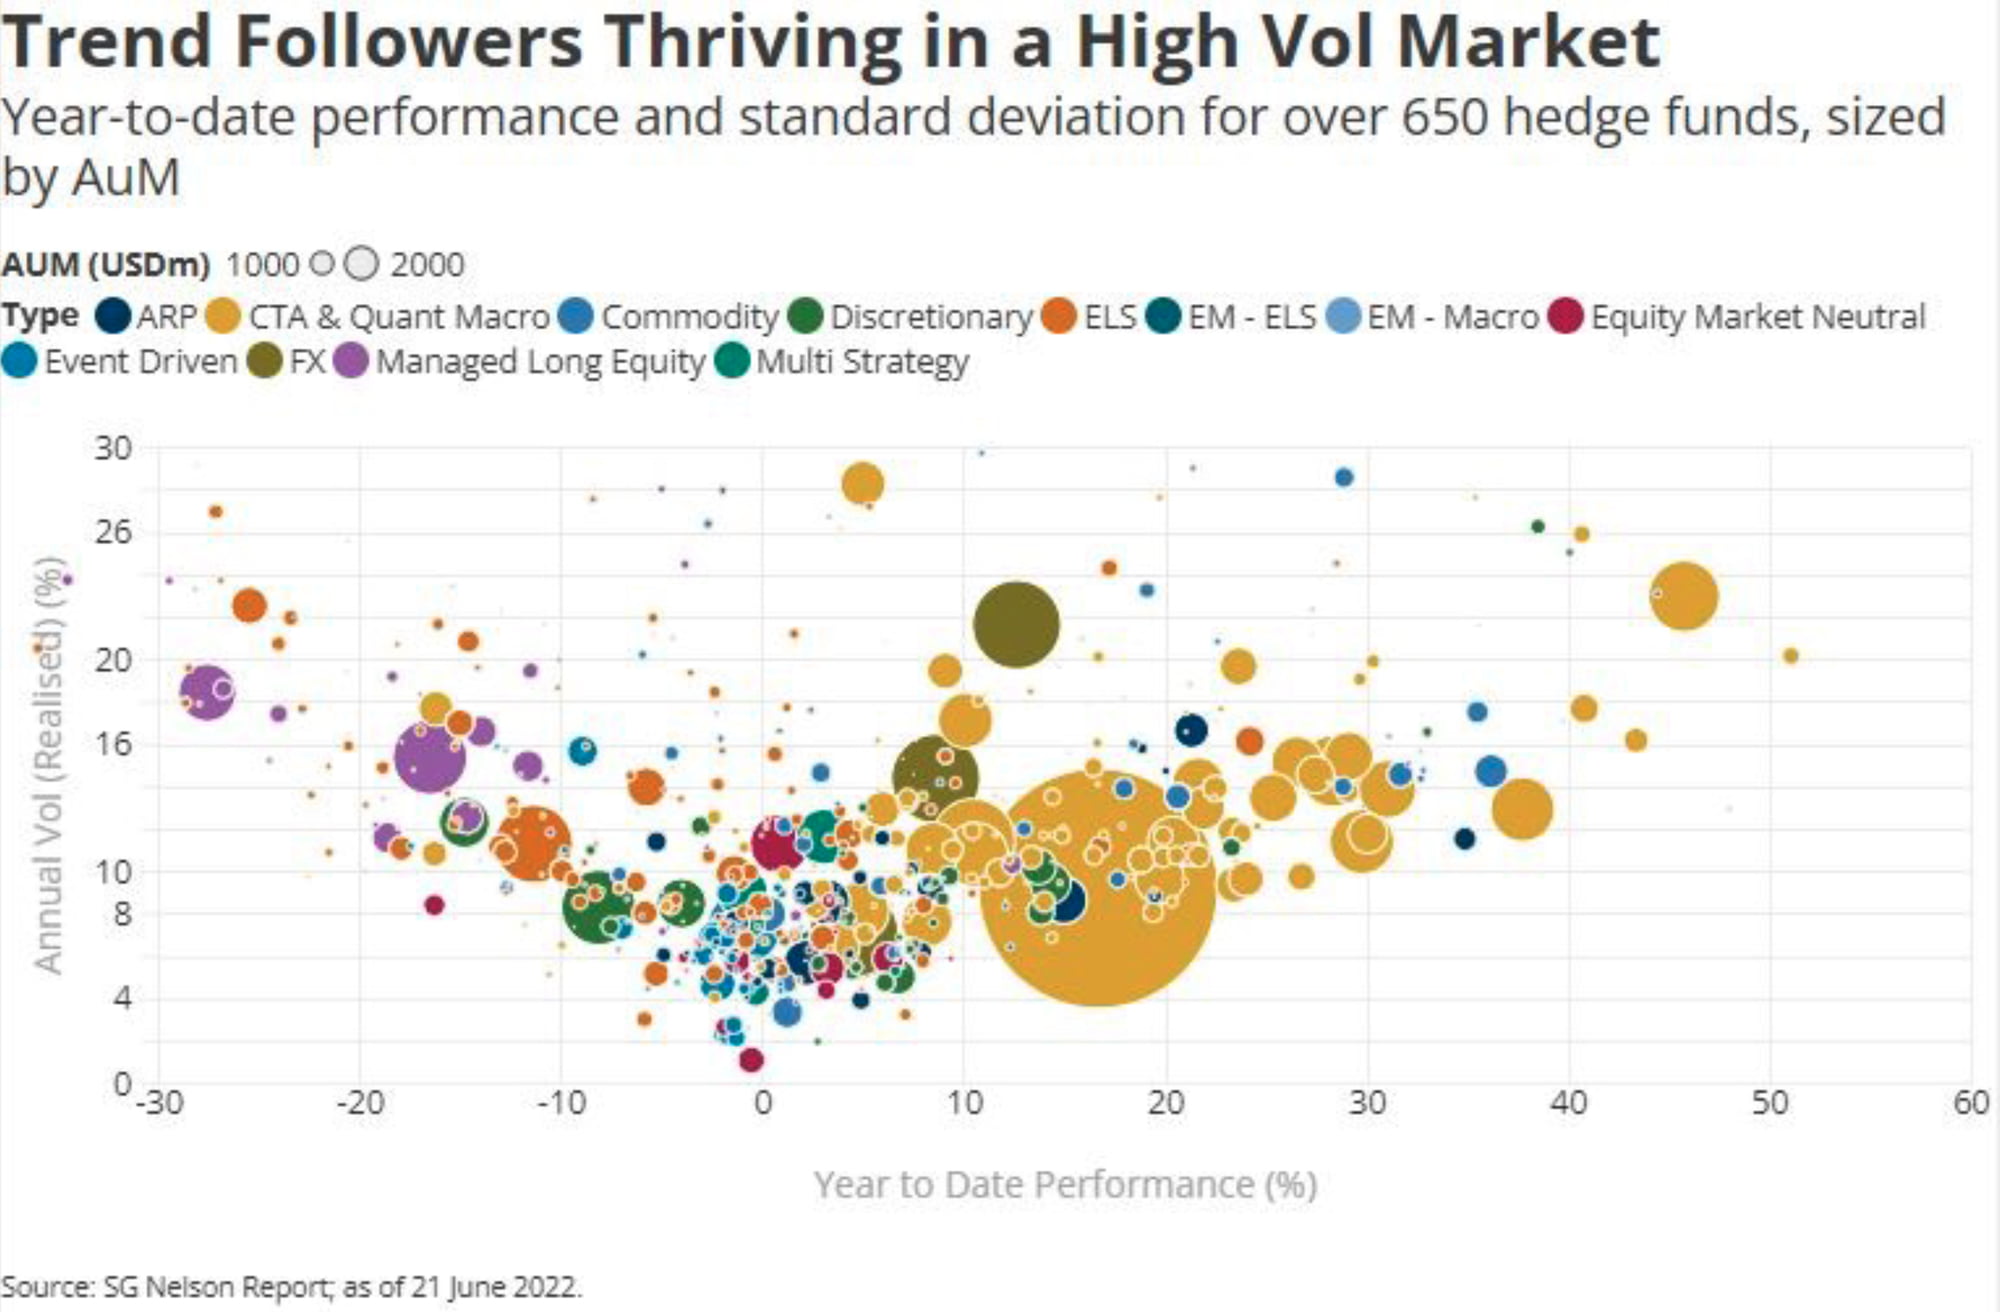
Investing, ultimately, is a behavioural problem as much as an intellectual one. Faced with the challenging market environment we’ve described over the last few pages, investors are, perhaps understandably, looking for an alternative safe haven that can deliver more reliably when bonds and equities fail. The top chart shows the year-to-date performance of a variety of hedge fund strategies, coloured by style and sized by assets under management, with performance on the X-axis and volatility on the Y-axis.
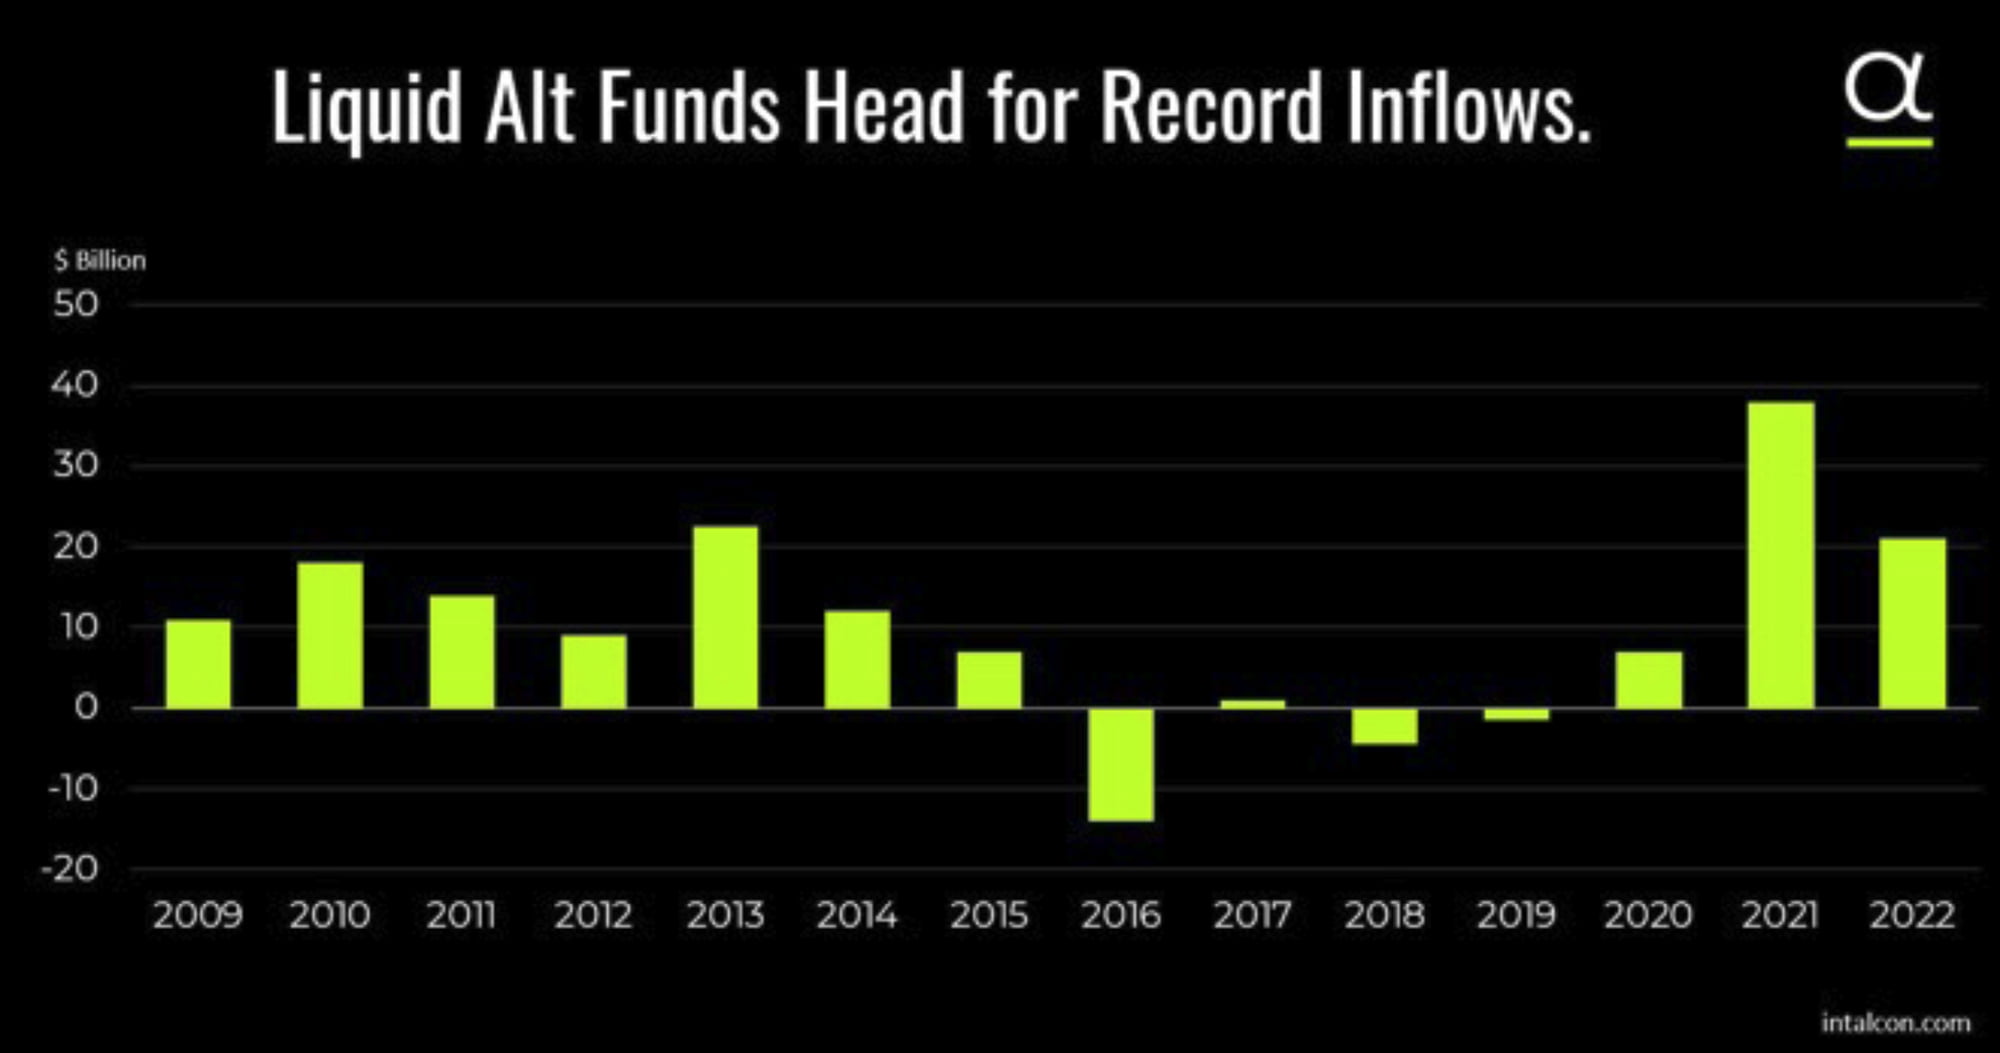
Unsurprisingly, long equity (purple) is one of the weakest sectors, while all those yellow dots over the right-hand side are, you guessed it, quant macro and trend-followers, which are two of the biggest parts of the liquid alt landscape. So is it surprising that the liquid alternative universe is heading for its biggest inflow year ever (bottom chart)? Probably not. But maybe this is a case of investors doing the right thing for the wrong reason. Unfortunately, I suspect that we might well see a reversal of these flows as soon as we see a performance speedbump.
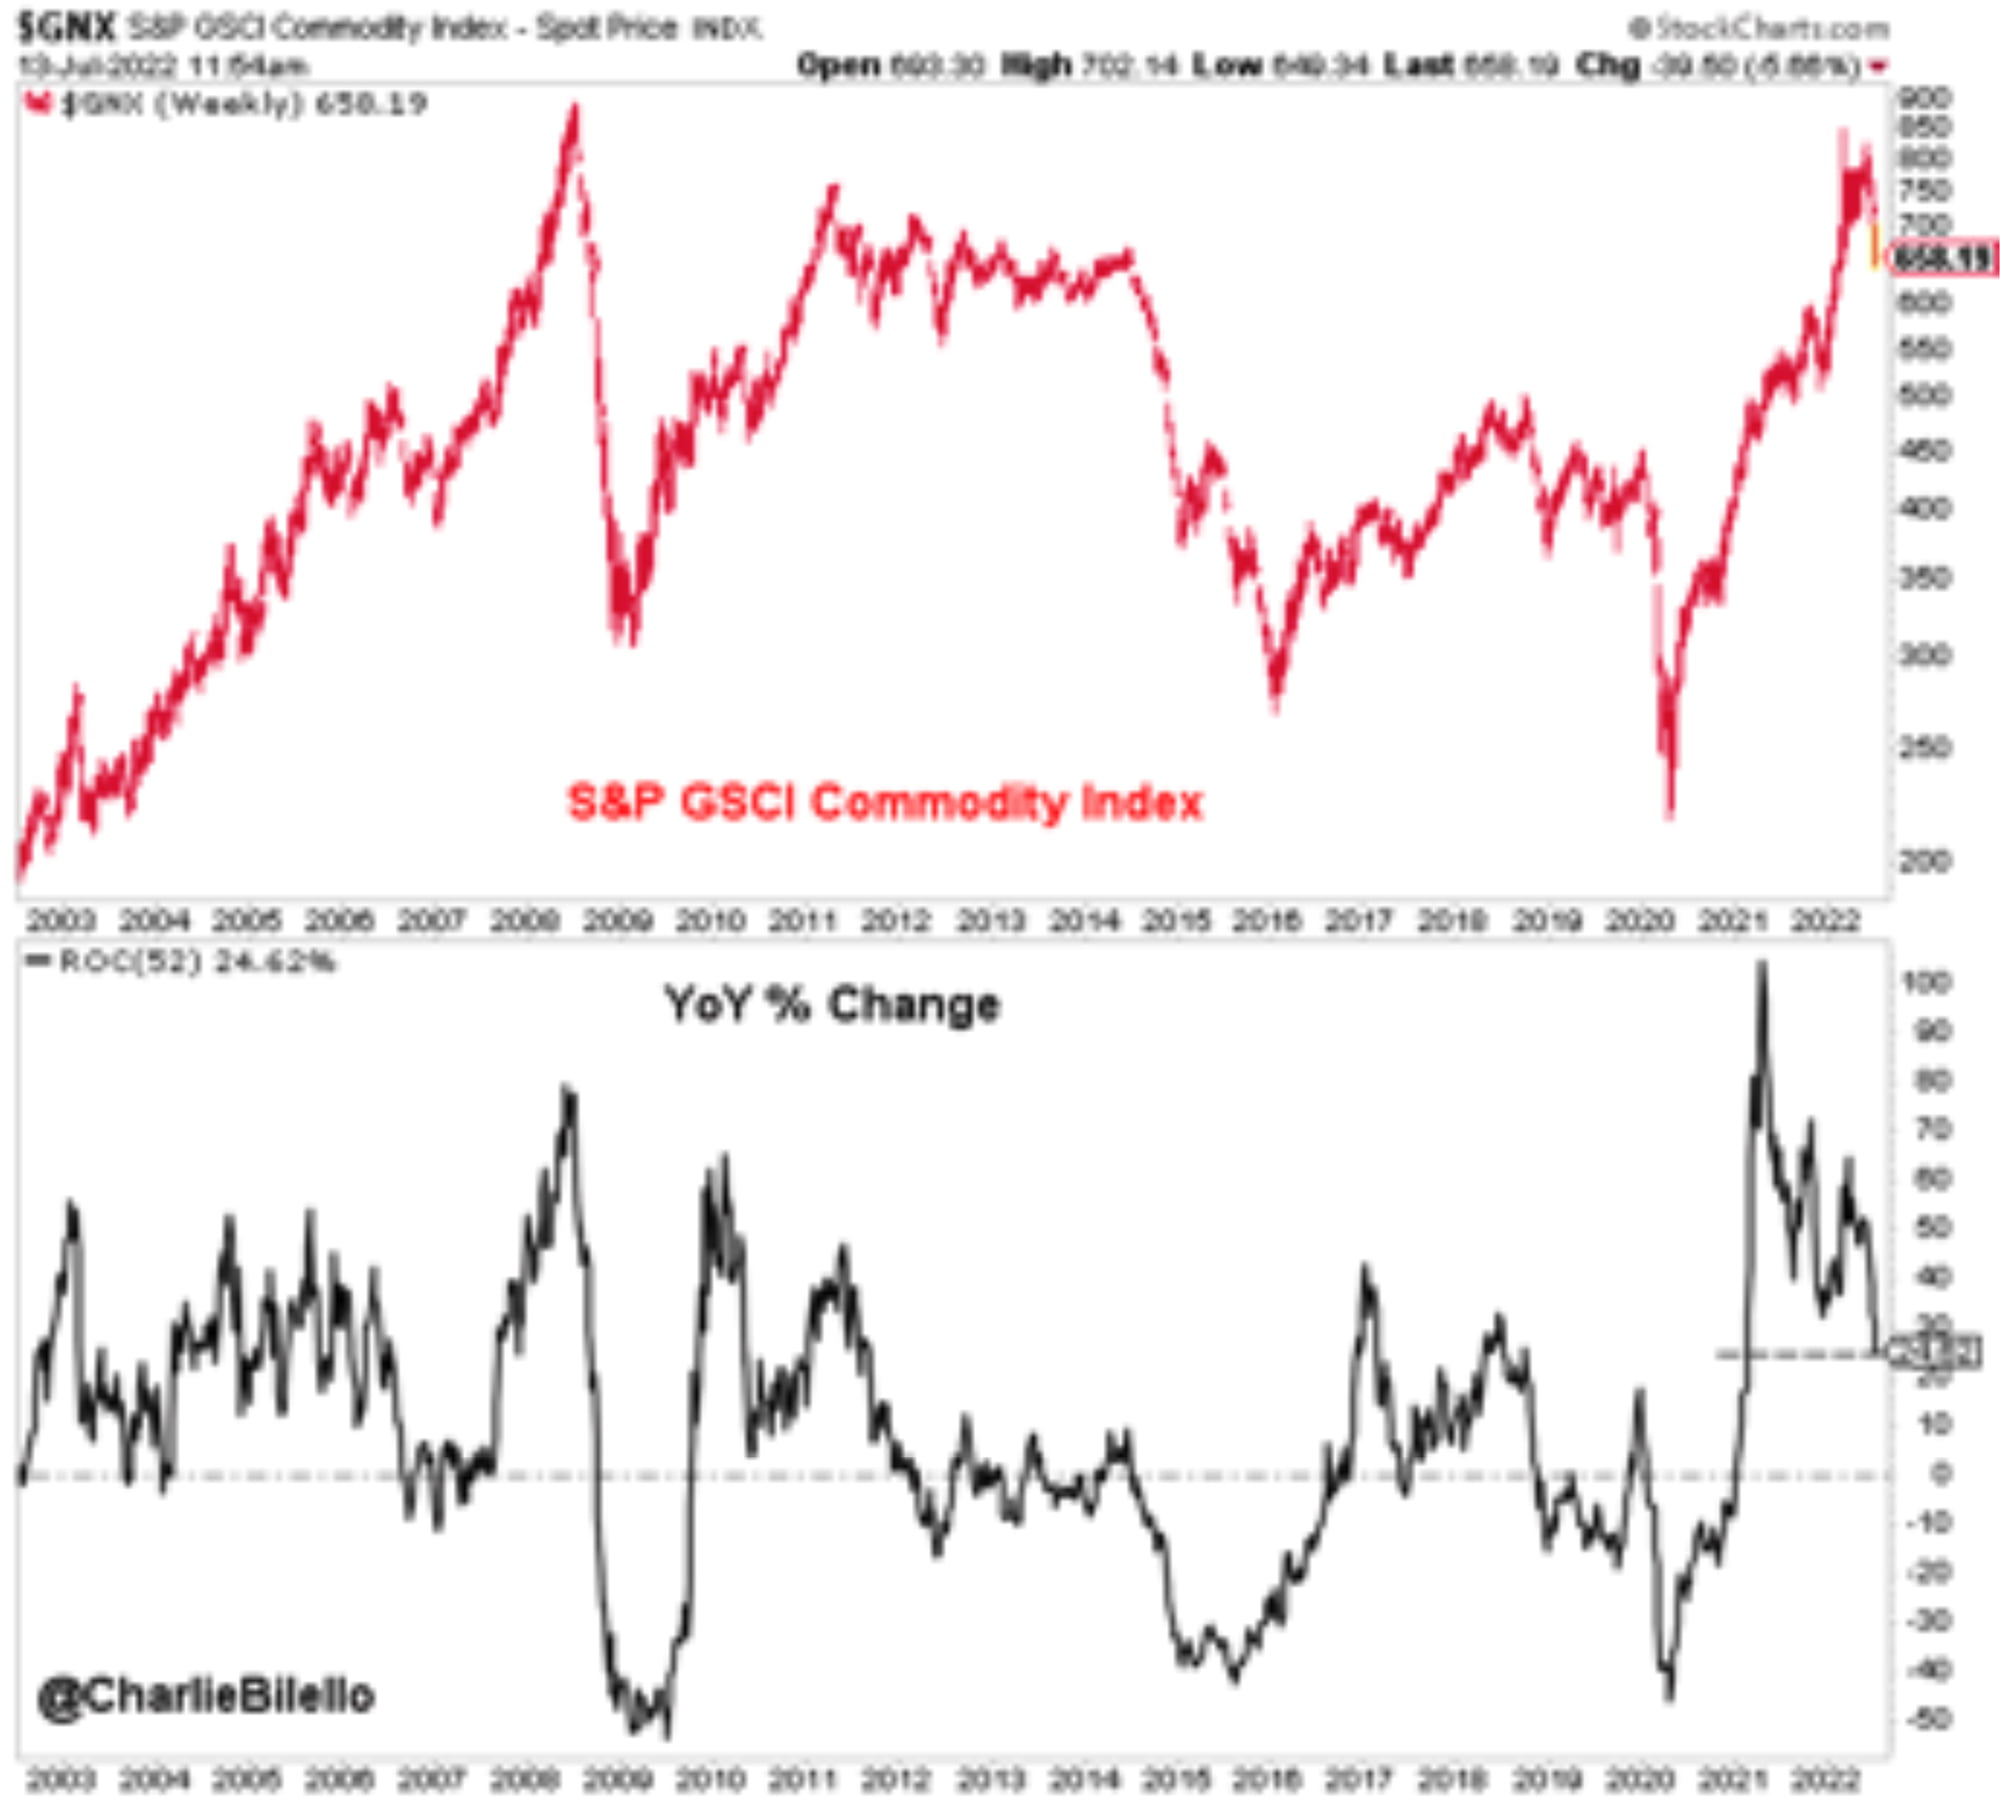
Don’t worry too much about the detail here – the top chart is the S&P GSCI Commodity index in price terms, while the bottom one shows the same index performance on a year-on-year basis. The latter shows us the impact of the ‘base effect’ – essentially the extent to which price rises are rolling out of the current data. The y/y change has fallen all the way from 100% down to just 25% y/y and, barring further rises in commodities, will now continue to fall until it hits 0% sometime around 6-months from now, in March 2023.
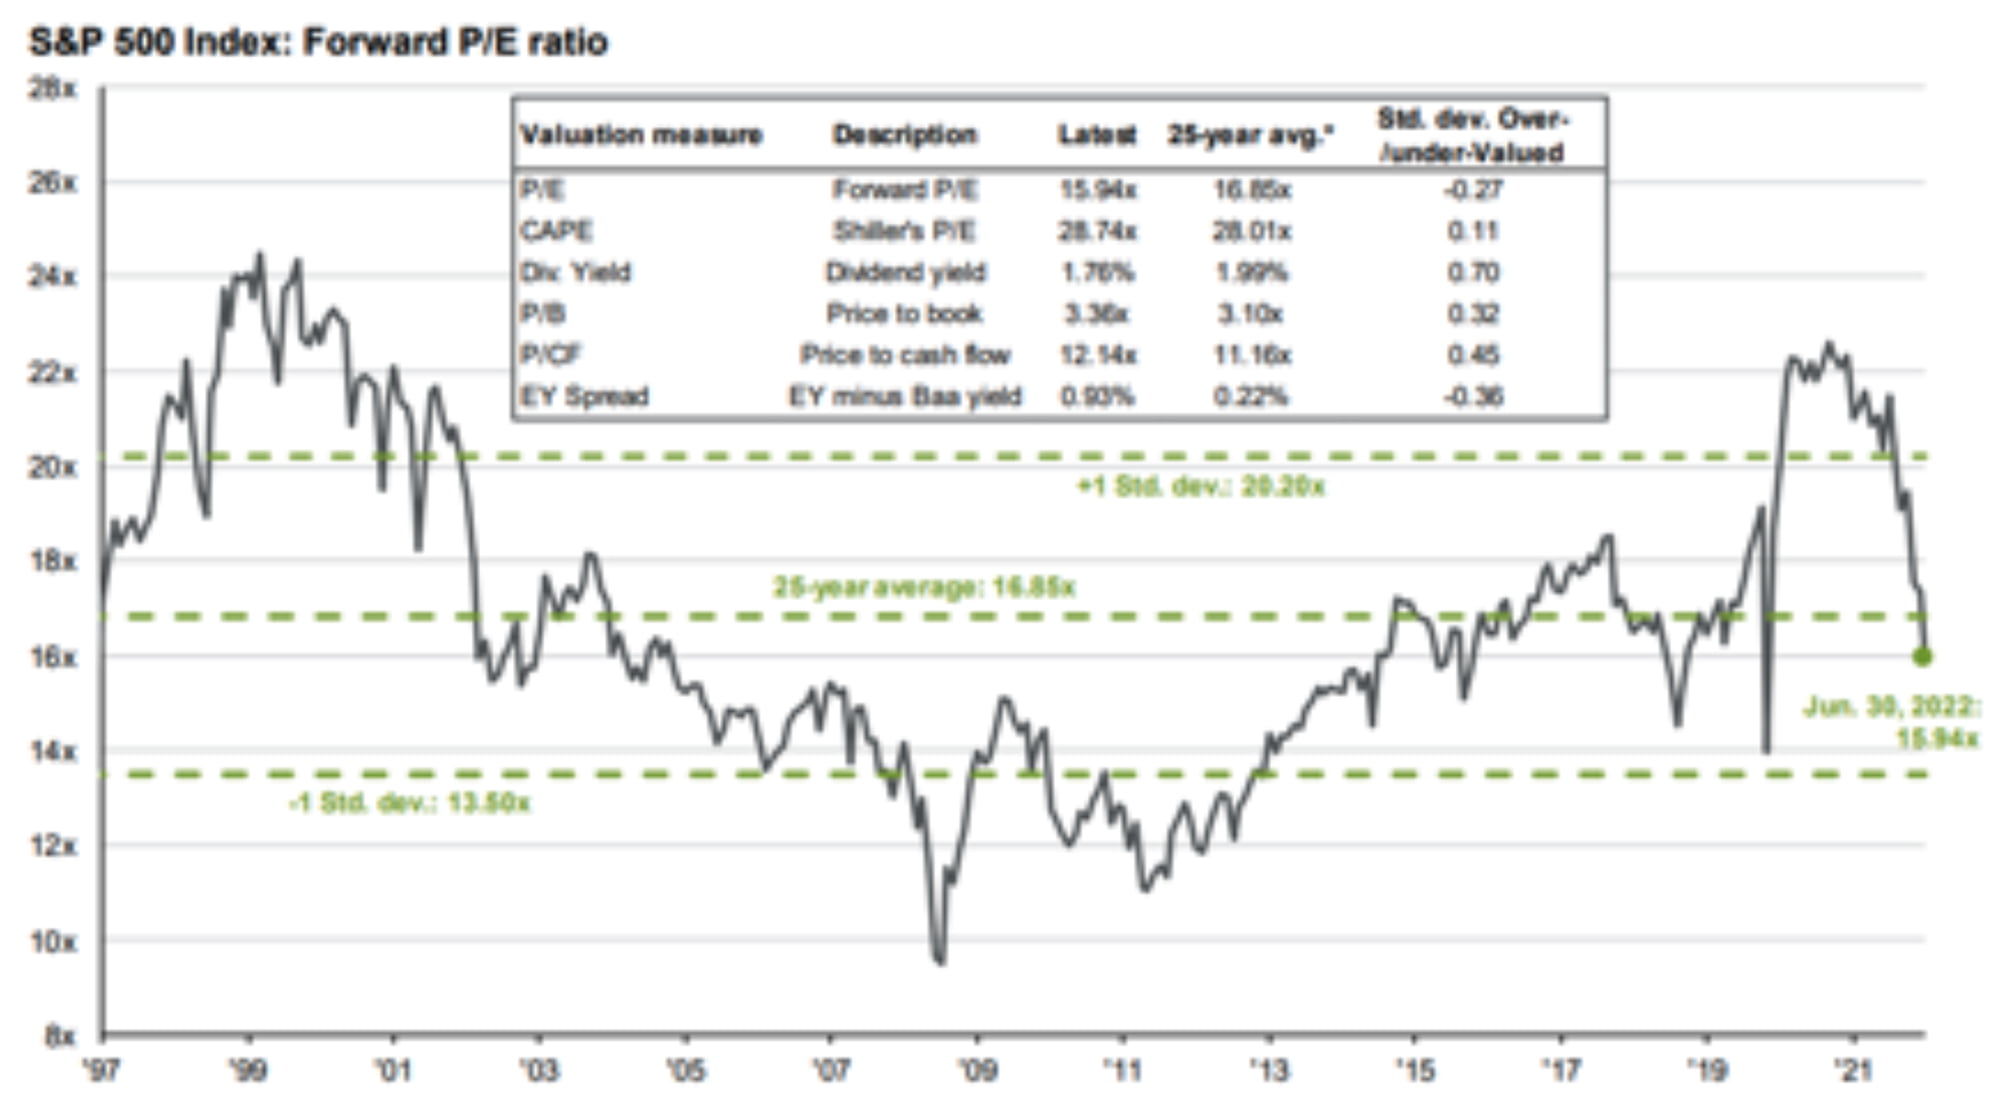
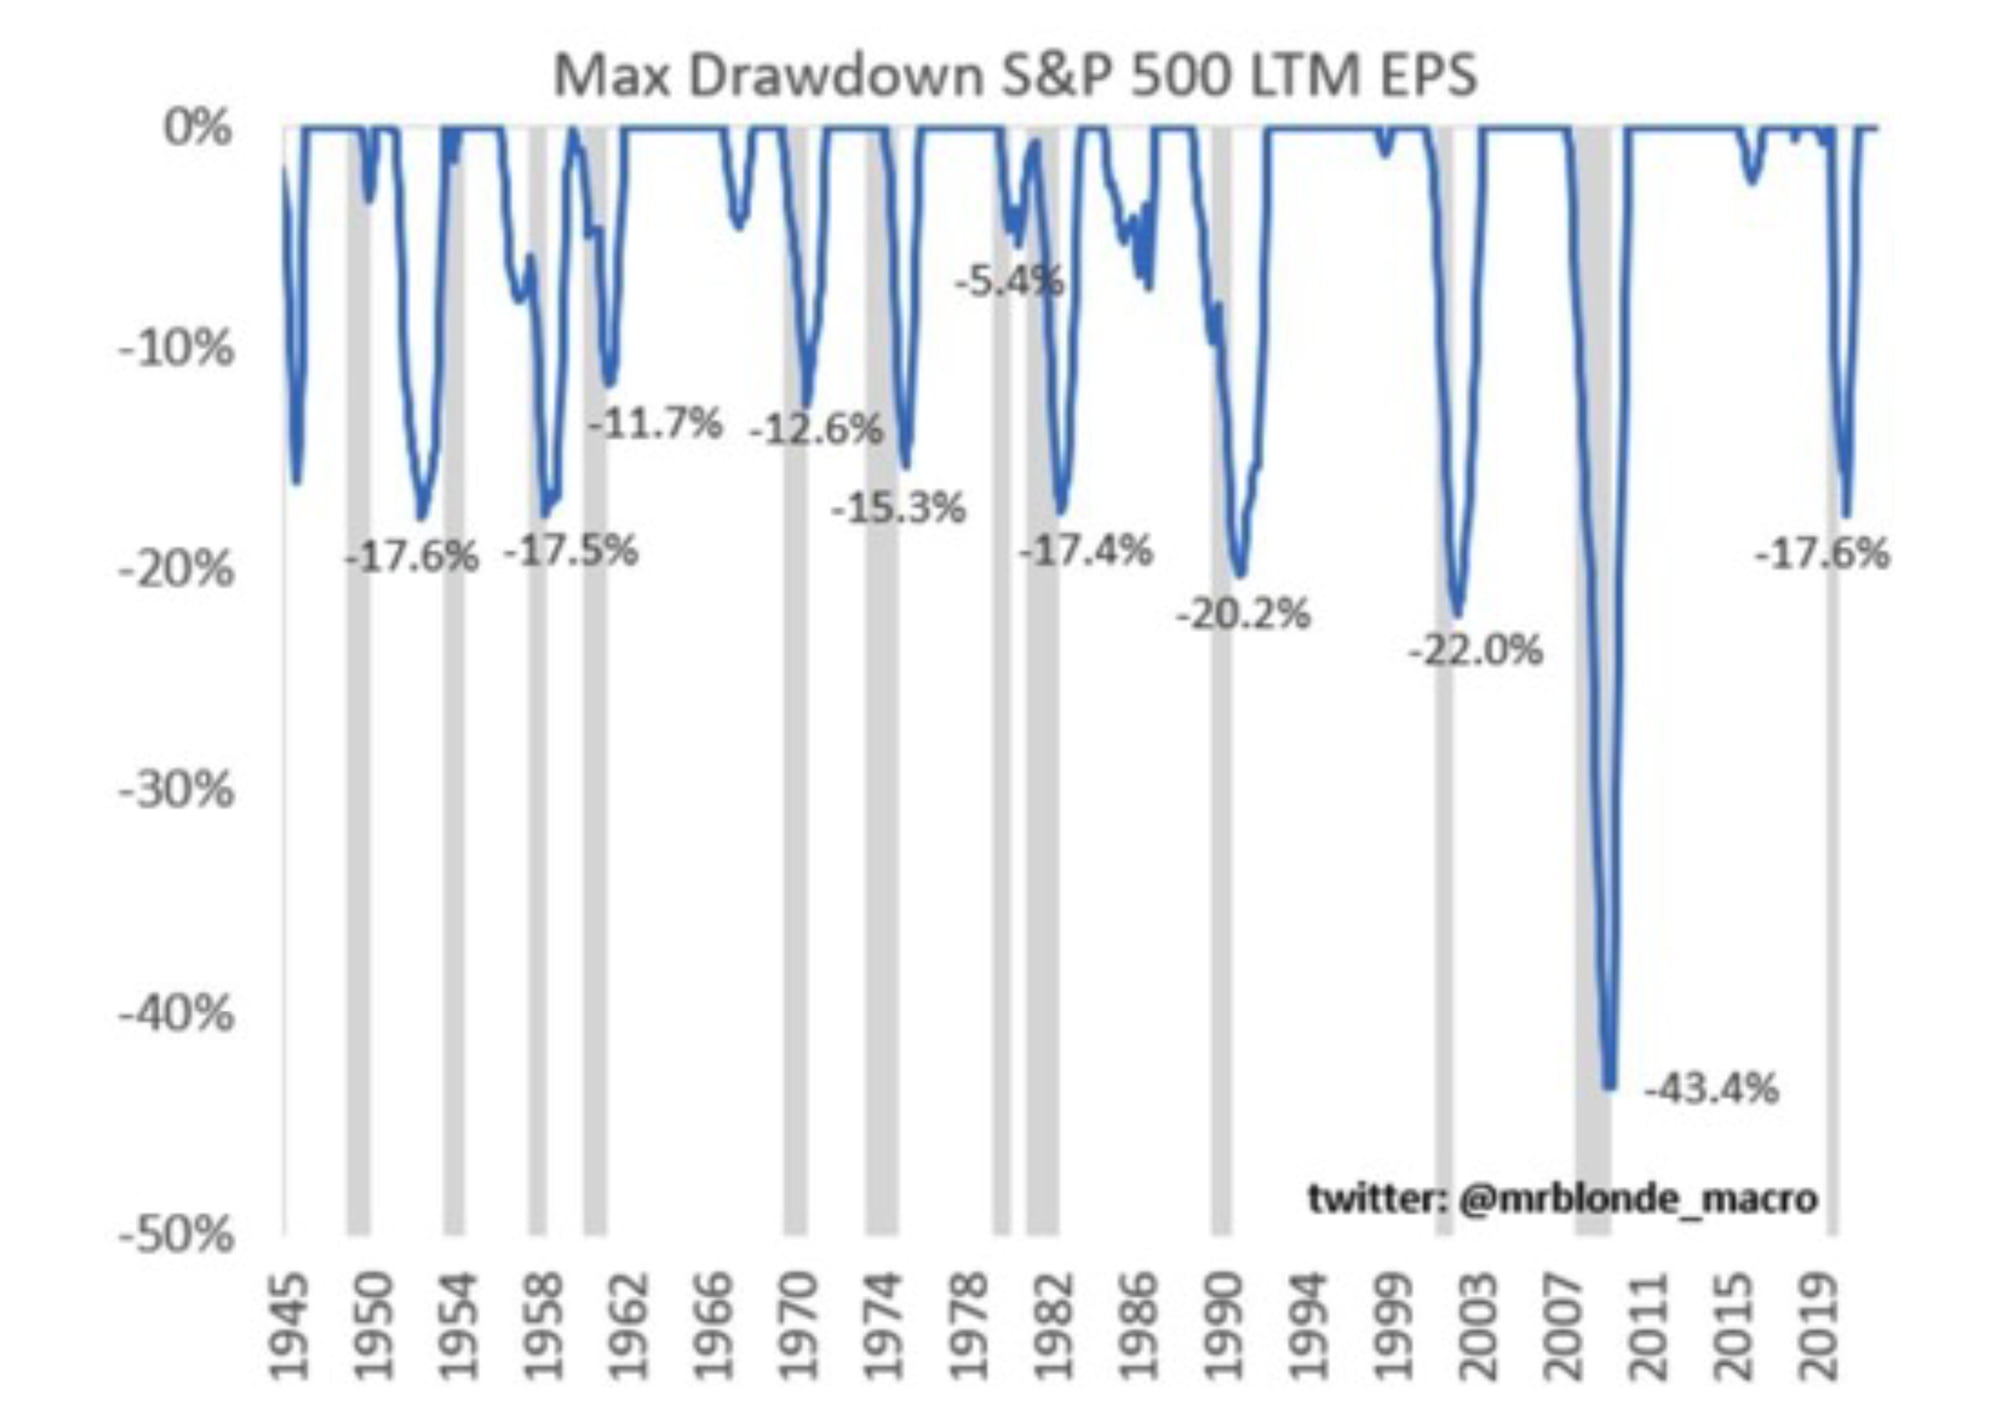
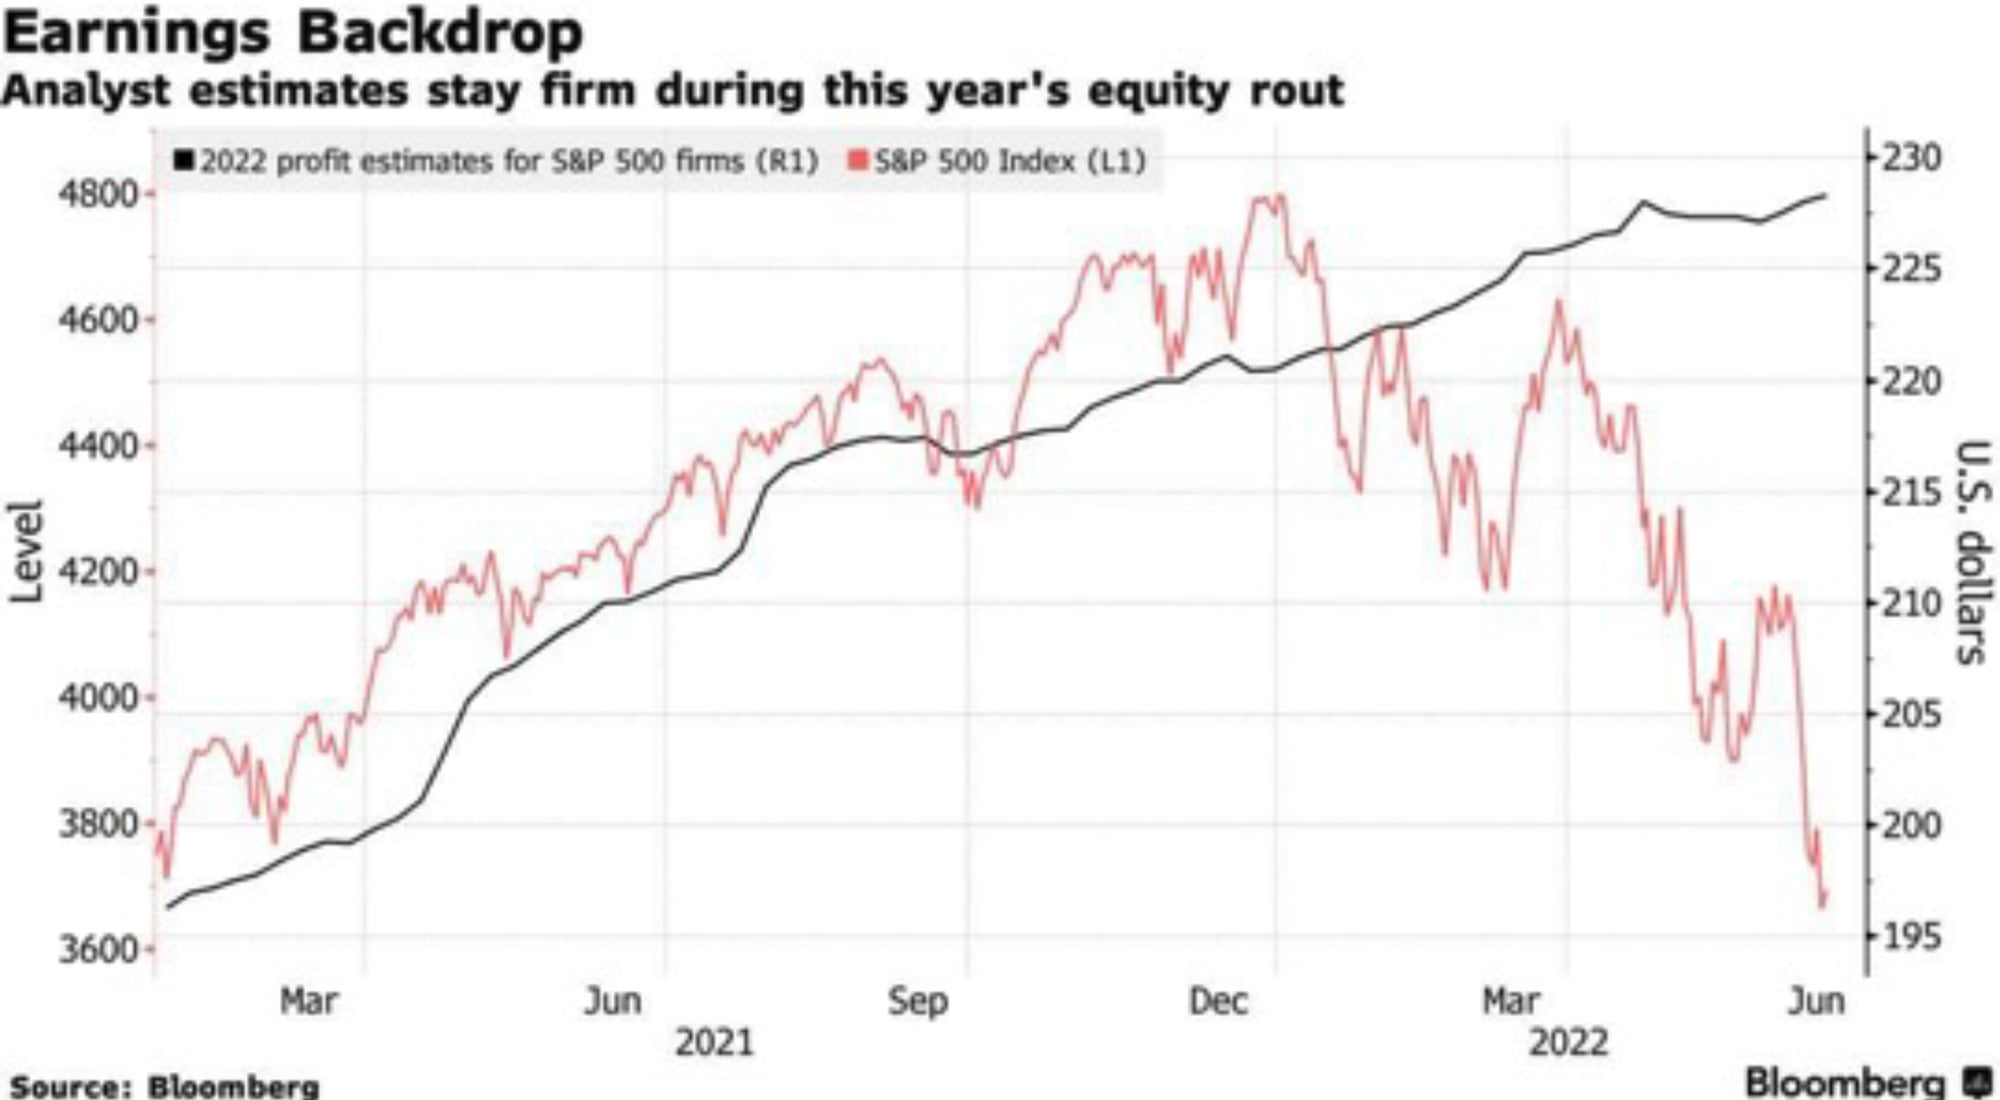
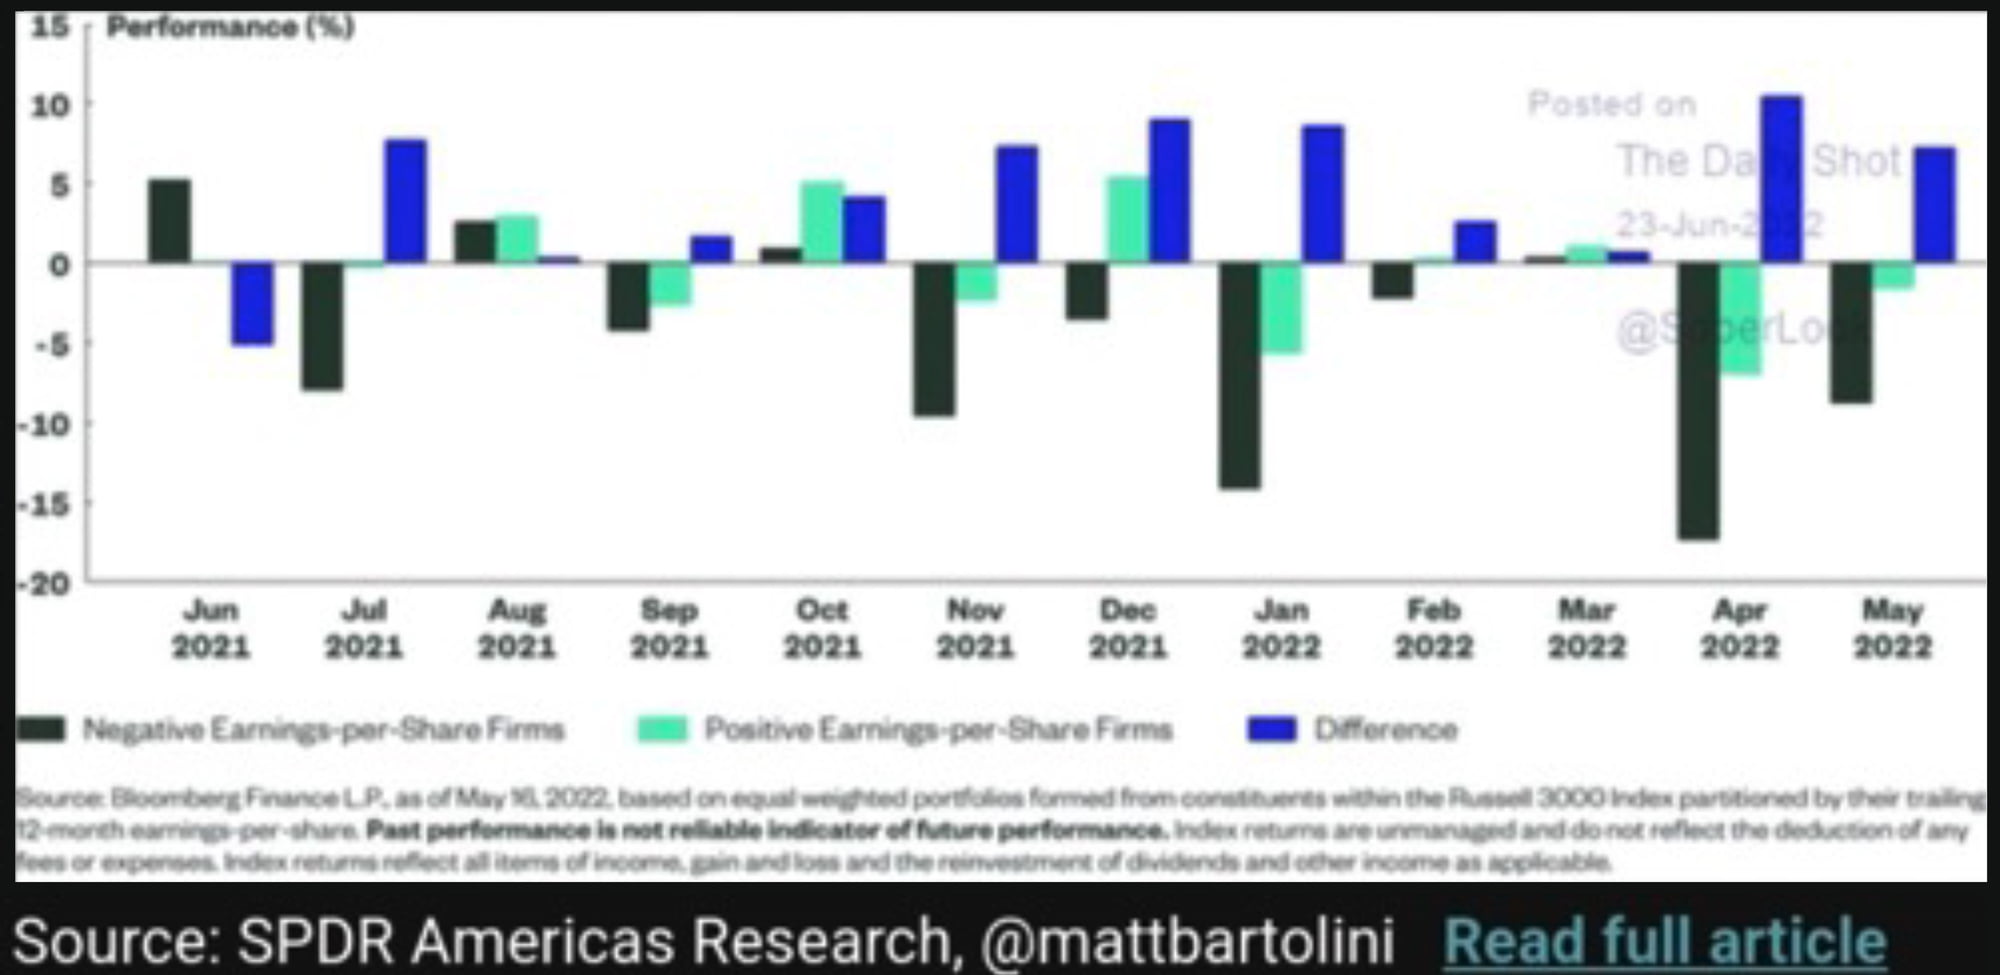
P/E ratios in the US have normalised (chart from JPM top left), although they don’t yet look cheap. That brings earnings into focus – so far, analysts have held their expectations of modest earnings growth firm (chart top right) despite the significant market volatility. This seems to be at odds with the bond market, which is now pricing something like a 50/50 chance of entering a recession in the next two years. If we do enter a recession, history tells us that earnings-per-share fall an average of ~17% during those periods (chart bottom left). At the same time, companies delivering positive earnings have outperformed through every one of the last 12 months (chart bottom right), so it seems that the market is looking at the right thing. So, who’s right, stock analysts or the bond market? My money says the bond market, and those analyst earnings estimates will be chiselled through Q3 and Q4 as the economy slows and inflation bites – we’re already seeing it impacting consumer confidence very significantly.
Disclaimer
For professional investors only. Not suitable for private customers. The information herein was obtained from various sources. We do not guarantee every aspect of its accuracy. The information is for your private information and is for discussion purposes only.
Redington Ltd is regulated by the Financial Conduct Authority. Redington Ltd do not advise on all implications of the transactions described herein. This information is for discussion purposes and prior to undertaking any trade, you should also discuss with your professional tax, accounting and / or other relevant advisers how such particular trade(s) affect you. All analysis (whether in respect of tax, accounting, law or of any other nature), should be treated as illustrative only and not relied upon as accurate.
©Redington Limited 2022. All rights reserved. No reproduction, copy, transmission or translation in whole or in part of this presentation may be made without permission. Application for permission should be made to Redington Limited at the following address – Floor 6, One Angel Court, London, EC2R 7HJ.
Redington Limited (06660006) is registered in England and Wales. Registered office: One Angel Court, London, EC2R 7HJ
Redington Ltd.
Floor 6 One Angel CourtLondon EC2R 7HJ+44 (0)20 7250 3331
redington.co.uk