More common than you think
Pete DrewienkiewiczCIO, Global Assets
Find me on LinkedIn
For many years now we have been accustomed to the concept of negative stock-bond correlation – that is the premise that bonds perform well when stocks do not. This is often cited as one of the rationales behind the popular 60/40 portfolio mix, the true origins of which appear to be lost in the mists of time. As you can see, over the last 20 years, the correlation between US stocks and bonds has been quite low. It has averaged -0.06, and until recently, had not held above 0.5 for more than a month in the last two decades.
This may have given some market participants false comfort – indeed, for the last two decades, the 60/40 portfolio has been exceedingly hard to beat as an investment strategy. But when we examine the data over a longer time period it appears that the negative correlation to which we have become accustomed is a more recent phenomenon than you might think:
Going back to 1976, we see that the longer-term average correlation is 0.20, and that it appears that stocks and bonds have experienced significant periods of positive correlation and even many periods where the two asset classes have moved in lockstep, with bond yields rising as equity prices fall. Indeed, when you think a little harder about the impact of rising discount rates on all assets, it makes sense that bond price weakness may in fact lead to broad asset class weakness, as their prices need to fall to incorporate future higher returns.
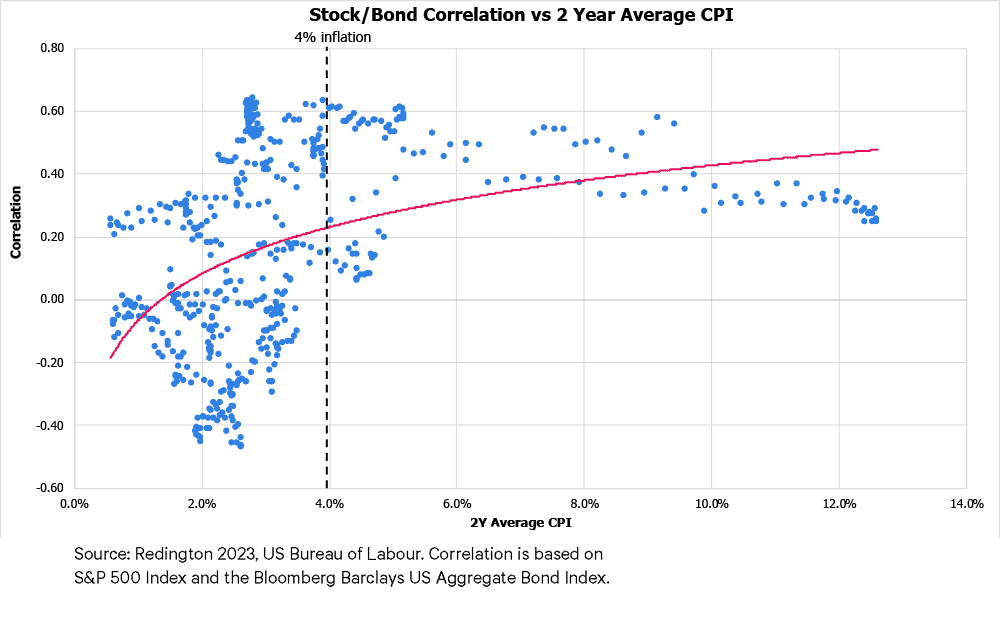
The missing piece of the puzzle is what drives these regimes; and we cut the data many ways. Is it the level of rates, the shape of the curve, or the rate of change in inflation? In fact, we find the relationship is simpler than some of these. When inflation over a 2-year period exceeds 4%, the correlation between stocks and bonds has never been negative.
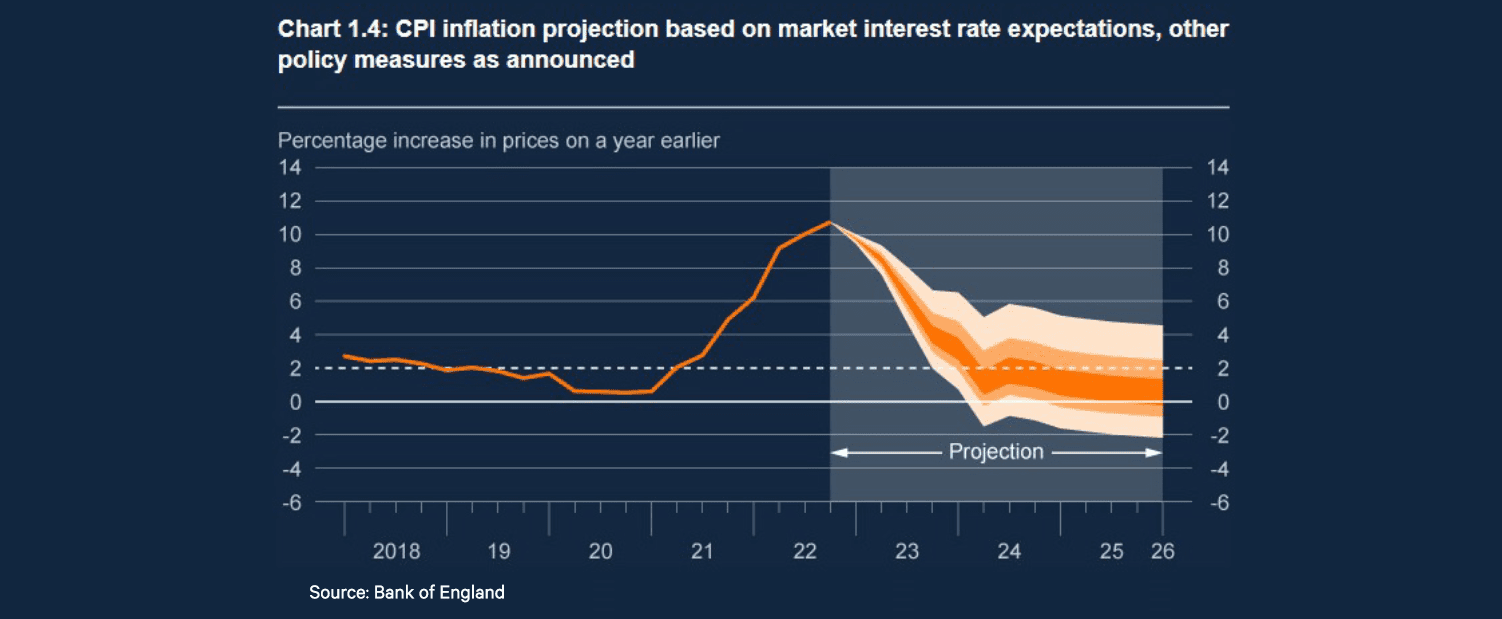
So far from being a surprise to us, as soon as it became clear that developed market inflation was not transitory, it was equally clear that bonds would not provide a safe haven for investors. Looking ahead, inflation is now projected to fall below 4% in the US by the end of Q2, with Eurozone and UK CPI not far behind. Indeed, the Bank of England’s latest projections, released in February’s Monetary Policy Report, now show CPI inflation falling to 1% at the two-year horizon and further still 12 months on from that, as illustrated on the right.
So, the key question for multi-asset investors in 2023 is: “it safe to get back in the water?” We believe as far as longer dated bonds go, the answer is not yet. We would prefer to see clear signs that inflation will fall below that key 4% mark in short order and that inflation expectations have not become unanchored. In the meantime, there are interesting opportunities in shorter dated, higher quality fixed income, where yields close to 6% remain available, and liquid alternatives, which we believe retain their attractive diversification properties even in the higher interest rate environment.